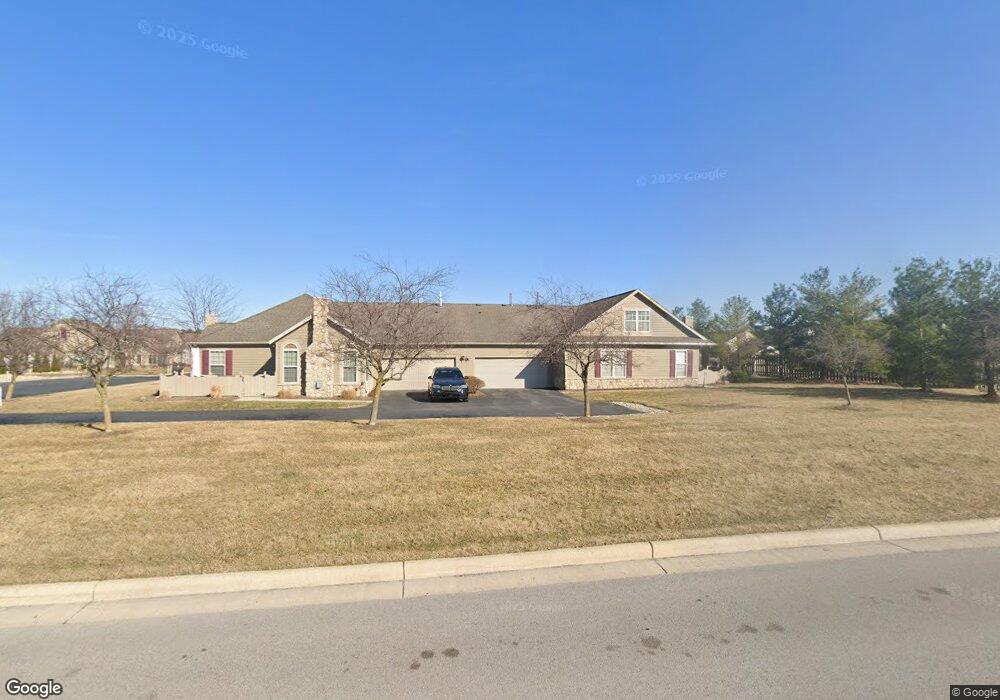
15385 South Point Dr Unit U9A Findlay, OH 45840
Estimated Value: $251,000 - $281,000
2
Beds
2
Baths
1,570
Sq Ft
$170/Sq Ft
Est. Value
About This Home
This home is located at 15385 South Point Dr Unit U9A, Findlay, OH 45840 and is currently estimated at $266,985, approximately $170 per square foot. 15385 South Point Dr Unit U9A is a home located in Hancock County with nearby schools including Van Buren Elementary School, Van Buren Middle School, and Van Buren High School.
Ownership History
Date
Name
Owned For
Owner Type
Purchase Details
Closed on
Aug 16, 2022
Sold by
Bower Janet S
Bought by
Jsk Irrevocable Trust
Current Estimated Value
Purchase Details
Closed on
Dec 8, 2017
Sold by
Dray Ruth E
Bought by
Bower Janet S
Purchase Details
Closed on
Jun 3, 2014
Sold by
Wittenmyer Rex O
Bought by
Wittenmyer Sandra A
Purchase Details
Closed on
Feb 18, 2010
Sold by
Knapp Mary Lou
Bought by
Wittenmyer Rex O and Wittenmyer Sandra A
Home Financials for this Owner
Home Financials are based on the most recent Mortgage that was taken out on this home.
Original Mortgage
$69,000
Interest Rate
5.02%
Mortgage Type
Unknown
Create a Home Valuation Report for This Property
The Home Valuation Report is an in-depth analysis detailing your home's value as well as a comparison with similar homes in the area
Home Values in the Area
Average Home Value in this Area
Purchase History
| Date | Buyer | Sale Price | Title Company |
|---|---|---|---|
| Jsk Irrevocable Trust | -- | None Listed On Document | |
| Bower Janet S | $166,600 | Mid An Title Agency | |
| Wittenmyer Sandra A | -- | Attorney | |
| Wittenmyer Rex O | $138,000 | Mid Am Title |
Source: Public Records
Mortgage History
| Date | Status | Borrower | Loan Amount |
|---|---|---|---|
| Previous Owner | Wittenmyer Rex O | $69,000 |
Source: Public Records
Tax History Compared to Growth
Tax History
| Year | Tax Paid | Tax Assessment Tax Assessment Total Assessment is a certain percentage of the fair market value that is determined by local assessors to be the total taxable value of land and additions on the property. | Land | Improvement |
|---|---|---|---|---|
| 2024 | $2,161 | $68,930 | $3,680 | $65,250 |
| 2023 | $2,150 | $68,930 | $3,680 | $65,250 |
| 2022 | $2,151 | $68,930 | $3,680 | $65,250 |
| 2021 | $1,898 | $57,240 | $2,800 | $54,440 |
| 2020 | $1,896 | $57,240 | $2,800 | $54,440 |
| 2019 | $1,963 | $57,240 | $2,800 | $54,440 |
| 2018 | $1,851 | $53,210 | $2,800 | $50,410 |
| 2017 | $929 | $53,210 | $2,800 | $50,410 |
| 2016 | $1,517 | $53,210 | $2,800 | $50,410 |
| 2015 | $1,333 | $47,250 | $2,800 | $44,450 |
| 2014 | $1,595 | $47,250 | $2,800 | $44,450 |
| 2012 | $1,897 | $51,650 | $2,800 | $48,850 |
Source: Public Records
Map
Nearby Homes
- 7752 E Point Dr
- 7665 Brookstone Dr
- 7711 E Watermark Dr
- 7633 Brookstone Dr
- 15329 E Us Route 224
- 0 E Us Route 224
- 7507 Township Road 212
- 0 Forest Ln Unit Lot 258
- 0 Meadowview Dr
- 8100 Shawnee Forest Dr
- 8130 Shawnee Forest Dr
- 8419 E Woodland Trail
- 0 Lakeside Dr
- 7137 Township Road 212
- 2309 Lonetree Dr
- 0 Hickory Ln Unit 1 307878
- 0 Hickory Ln Unit 20252999
- 0 Hickory Ln Unit 1
- 8405 Indian Lake Dr
- 16078 Forest Lake Dr
- 15385 S Point Dr
- 15379 South Point Dr
- 15379 S Point Dr Unit U10-15
- 15389 South Point Dr
- 15389 S Point Dr
- 15383 South Point Dr
- 15377 South Point Dr
- 15387 South Point Dr
- 15375 South Point Dr
- 15375 South Point Dr
- 15395 South Point Dr
- 15392 Bent Tree Dr
- 15408 Bent Tree Dr
- 15393 South Point Dr
- 15373 South Point Dr
- 15424 Bent Tree Dr
- 15378 Bent Tree Dr
- 15387 S Point Dr
- 7756 East Point Dr Unit 87756
- 7756 East Point Dr Unit U8-775