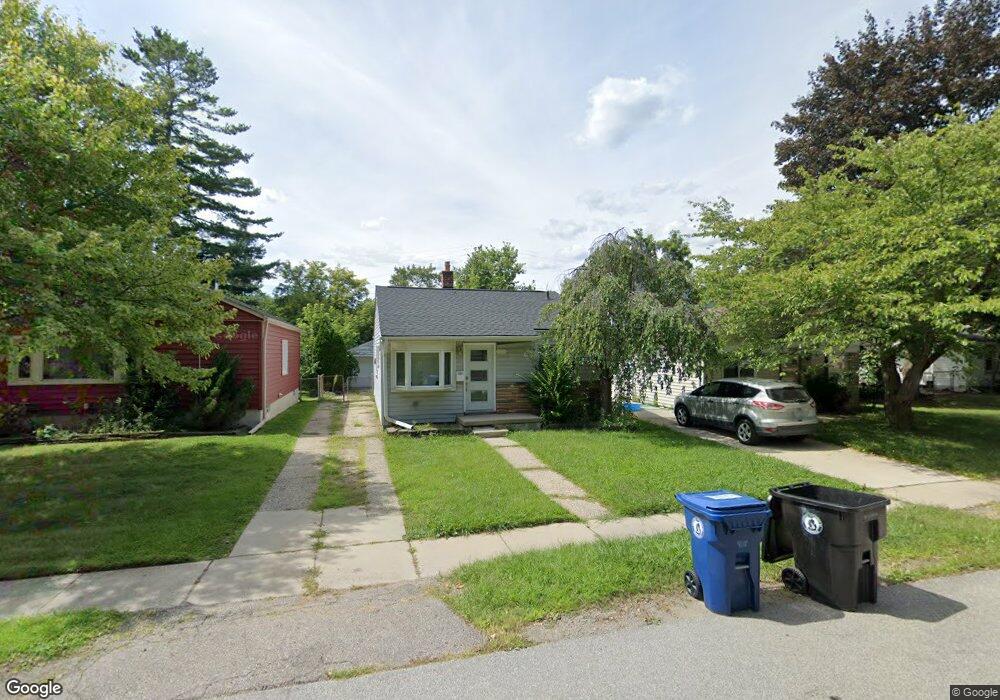
15389 Fenton Redford, MI 48239
Estimated Value: $92,000 - $124,000
--
Bed
1
Bath
768
Sq Ft
$142/Sq Ft
Est. Value
About This Home
This home is located at 15389 Fenton, Redford, MI 48239 and is currently estimated at $109,253, approximately $142 per square foot. 15389 Fenton is a home located in Wayne County with nearby schools including Beech Elementary School, Hilbert Middle School, and Redford Union High School.
Ownership History
Date
Name
Owned For
Owner Type
Purchase Details
Closed on
Apr 28, 2006
Sold by
Fannie Mae
Bought by
Wesley Vencent L
Current Estimated Value
Purchase Details
Closed on
May 13, 2005
Sold by
Mortgage Electronic Registration Systems
Bought by
Federal National Mortgage Association
Purchase Details
Closed on
May 4, 2005
Sold by
Hillstead David
Bought by
Mortgage Electronic Registration Systems
Purchase Details
Closed on
Feb 7, 2003
Sold by
Navarro Susan
Bought by
Hillstead David
Purchase Details
Closed on
May 22, 1997
Sold by
Melissa L Reamer and Melissa Conra
Bought by
Susan Walker
Create a Home Valuation Report for This Property
The Home Valuation Report is an in-depth analysis detailing your home's value as well as a comparison with similar homes in the area
Home Values in the Area
Average Home Value in this Area
Purchase History
| Date | Buyer | Sale Price | Title Company |
|---|---|---|---|
| Wesley Vencent L | $58,000 | Greco | |
| Federal National Mortgage Association | -- | -- | |
| Mortgage Electronic Registration Systems | $97,124 | -- | |
| Hillstead David | $78,000 | Multiple | |
| Susan Walker | $47,000 | -- |
Source: Public Records
Tax History Compared to Growth
Tax History
| Year | Tax Paid | Tax Assessment Tax Assessment Total Assessment is a certain percentage of the fair market value that is determined by local assessors to be the total taxable value of land and additions on the property. | Land | Improvement |
|---|---|---|---|---|
| 2025 | $501 | $49,000 | $0 | $0 |
| 2024 | $501 | $43,600 | $0 | $0 |
| 2023 | $478 | $37,200 | $0 | $0 |
| 2022 | $1,268 | $30,300 | $0 | $0 |
| 2021 | $1,232 | $29,100 | $0 | $0 |
| 2020 | $1,217 | $24,600 | $0 | $0 |
| 2019 | $1,192 | $21,400 | $0 | $0 |
| 2018 | $431 | $18,300 | $0 | $0 |
| 2017 | $1,112 | $17,200 | $0 | $0 |
| 2016 | $978 | $17,600 | $0 | $0 |
| 2015 | $1,548 | $16,100 | $0 | $0 |
| 2013 | $1,500 | $15,700 | $0 | $0 |
| 2012 | $1,103 | $16,800 | $4,100 | $12,700 |
Source: Public Records
Map
Nearby Homes