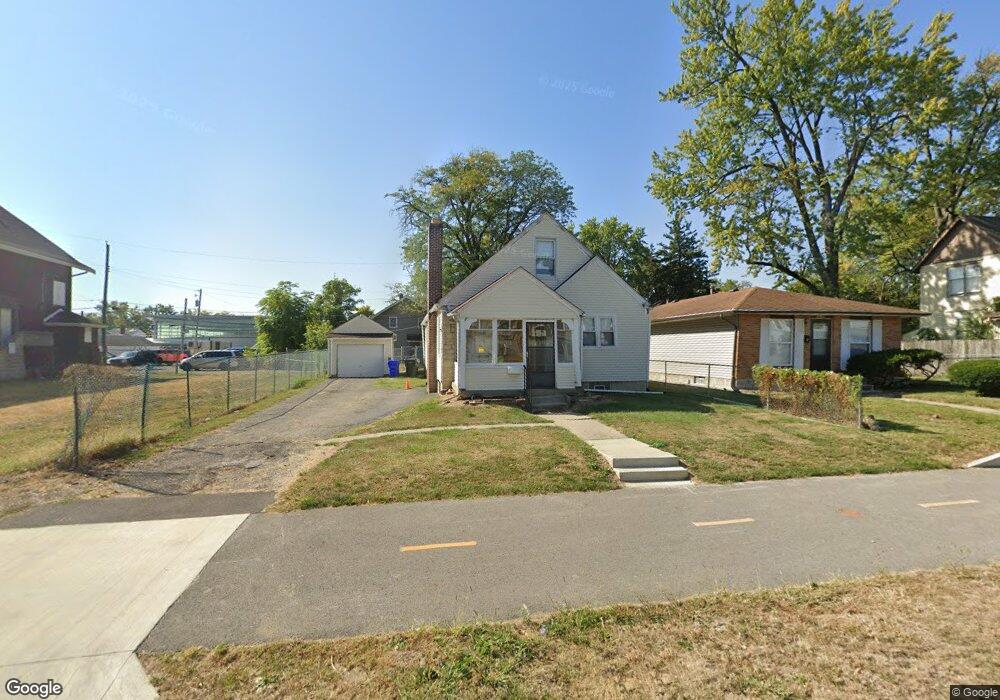
1539 E Hudson St Columbus, OH 43211
South Linden NeighborhoodEstimated Value: $132,000 - $179,000
3
Beds
2
Baths
1,328
Sq Ft
$119/Sq Ft
Est. Value
About This Home
This home is located at 1539 E Hudson St, Columbus, OH 43211 and is currently estimated at $157,384, approximately $118 per square foot. 1539 E Hudson St is a home located in Franklin County with nearby schools including Linden-Mckinley Stem School On Arcadia, North Columbus Preparatory Academy, and Focus Learning Academy of Central Columbus.
Ownership History
Date
Name
Owned For
Owner Type
Purchase Details
Closed on
Apr 17, 2007
Sold by
Fifth Third Mortgage Co
Bought by
Derstine Craig C
Current Estimated Value
Purchase Details
Closed on
Feb 5, 2007
Sold by
Green Donald F and Case #06Cve07 9178
Bought by
Fifth Third Mortgage Co
Purchase Details
Closed on
Apr 2, 2004
Sold by
Fifth Third Mortgage Co
Bought by
Dfg2 Llc
Home Financials for this Owner
Home Financials are based on the most recent Mortgage that was taken out on this home.
Original Mortgage
$32,271
Interest Rate
5.48%
Mortgage Type
Purchase Money Mortgage
Purchase Details
Closed on
Nov 3, 2003
Sold by
Houston Nolie and Case #03Cve04 4297
Bought by
Fifth Third Mortgage Co
Purchase Details
Closed on
May 3, 1993
Bought by
Houston Nolie Jr
Purchase Details
Closed on
Aug 1, 1984
Create a Home Valuation Report for This Property
The Home Valuation Report is an in-depth analysis detailing your home's value as well as a comparison with similar homes in the area
Home Values in the Area
Average Home Value in this Area
Purchase History
| Date | Buyer | Sale Price | Title Company |
|---|---|---|---|
| Derstine Craig C | $35,000 | None Available | |
| Fifth Third Mortgage Co | $40,000 | None Available | |
| Dfg2 Llc | $31,500 | Esquire Title Services Inc | |
| Fifth Third Mortgage Co | $28,000 | -- | |
| Houston Nolie Jr | $42,500 | -- | |
| -- | -- | -- |
Source: Public Records
Mortgage History
| Date | Status | Borrower | Loan Amount |
|---|---|---|---|
| Previous Owner | Dfg2 Llc | $32,271 |
Source: Public Records
Tax History Compared to Growth
Tax History
| Year | Tax Paid | Tax Assessment Tax Assessment Total Assessment is a certain percentage of the fair market value that is determined by local assessors to be the total taxable value of land and additions on the property. | Land | Improvement |
|---|---|---|---|---|
| 2024 | $1,601 | $34,940 | $6,200 | $28,740 |
| 2023 | $1,581 | $34,930 | $6,195 | $28,735 |
| 2022 | $741 | $13,940 | $2,980 | $10,960 |
| 2021 | $742 | $13,940 | $2,980 | $10,960 |
| 2020 | $743 | $13,940 | $2,980 | $10,960 |
| 2019 | $716 | $11,520 | $2,490 | $9,030 |
| 2018 | $821 | $11,520 | $2,490 | $9,030 |
| 2017 | $867 | $11,520 | $2,490 | $9,030 |
| 2016 | $1,018 | $14,990 | $3,330 | $11,660 |
| 2015 | $927 | $14,990 | $3,330 | $11,660 |
| 2014 | $929 | $14,990 | $3,330 | $11,660 |
| 2013 | $533 | $16,660 | $3,710 | $12,950 |
Source: Public Records
Map
Nearby Homes
- 1519 E Hudson St
- 1509 Loretta Ave
- 2230 Cleveland Ave
- 1435 Kohr Place
- 2163 Cleveland Ave Unit 2161
- 2157 Cleveland Ave Unit 2153
- 1457 Cordell Ave
- 1625 Kenmore Rd
- 1476 Republic Ave
- 1447 Republic Ave
- 1564-1566 E Blake Ave
- 1544 Briarwood Ave
- 1362 Clinton St
- 1554 E Maynard Ave
- 0 E Maynard Ave
- 1473 Arlington Ave
- 2214 Medina Ave
- 2204 Medina Ave
- 2225 Medina Ave
- 2260 Homestead Dr
- 1533 E Hudson St
- 1545 E Hudson St
- 1534 Kohr Place
- 1528 Kohr Place
- 1542 Kohr Place
- 1520 Kohr Place
- 1536 E Hudson St
- 1514 Kohr Place
- 1530 E Hudson St
- 1513 E Hudson St
- 645 Kohr Place
- 1508 Kohr Place
- 1520 E Hudson St
- 1507 E Hudson St
- 1514 E Hudson St
- 1500 Kohr Place
- 1508 E Hudson St
- 1513 Kohr Place
- 2256 Cleveland Ave
- 1495 E Hudson St