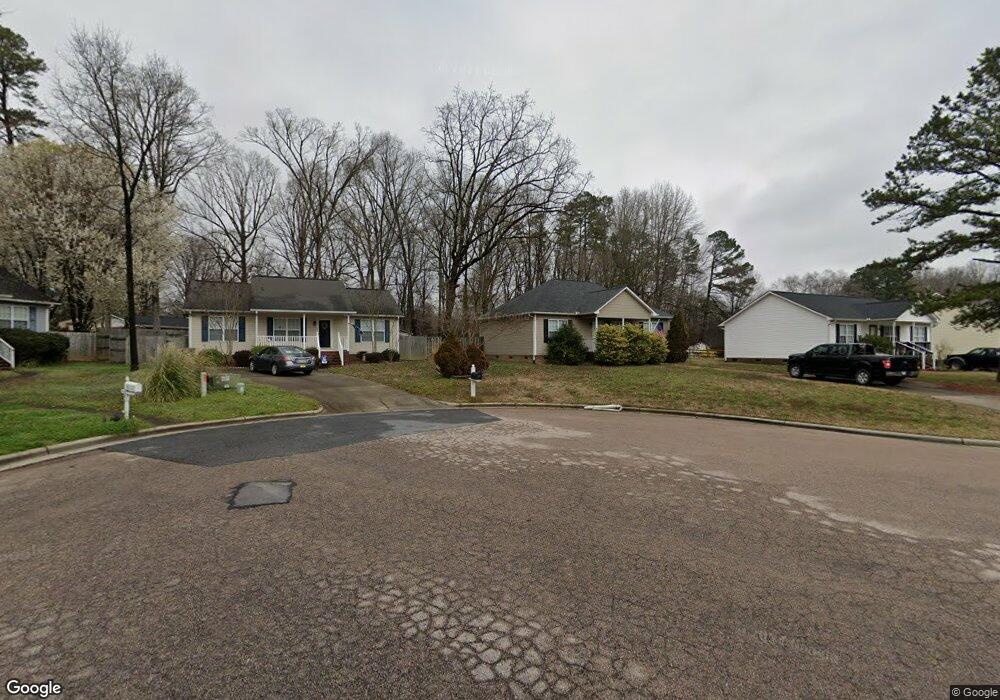
1539 Tammy Ct Kannapolis, NC 28083
Estimated Value: $283,000 - $306,000
3
Beds
2
Baths
1,171
Sq Ft
$249/Sq Ft
Est. Value
About This Home
This home is located at 1539 Tammy Ct, Kannapolis, NC 28083 and is currently estimated at $291,674, approximately $249 per square foot. 1539 Tammy Ct is a home located in Cabarrus County with nearby schools including Jackson Park Elementary School, Kannapolis Middle, and A.L. Brown High School.
Ownership History
Date
Name
Owned For
Owner Type
Purchase Details
Closed on
Mar 14, 2012
Sold by
Secretary Of Housing & Urban Development
Bought by
Hahn Eric Wesley
Current Estimated Value
Home Financials for this Owner
Home Financials are based on the most recent Mortgage that was taken out on this home.
Original Mortgage
$57,200
Outstanding Balance
$39,349
Interest Rate
3.9%
Mortgage Type
New Conventional
Estimated Equity
$252,325
Purchase Details
Closed on
Dec 20, 2011
Sold by
Carter Arthur E and Carter Barbara C
Bought by
The Secretary Of Housing & Urban Develop
Purchase Details
Closed on
May 23, 2011
Sold by
Milem Michael J and Milem Julie Diane
Bought by
The Secretary Of Housing & Urban Develop
Purchase Details
Closed on
May 20, 1999
Sold by
Quickel Development Company
Bought by
Milem Michael J and Milem Julie D
Home Financials for this Owner
Home Financials are based on the most recent Mortgage that was taken out on this home.
Original Mortgage
$91,104
Interest Rate
6.87%
Mortgage Type
FHA
Create a Home Valuation Report for This Property
The Home Valuation Report is an in-depth analysis detailing your home's value as well as a comparison with similar homes in the area
Home Values in the Area
Average Home Value in this Area
Purchase History
| Date | Buyer | Sale Price | Title Company |
|---|---|---|---|
| Hahn Eric Wesley | -- | None Available | |
| The Secretary Of Housing & Urban Develop | -- | None Available | |
| The Secretary Of Housing & Urban Develop | $77,221 | None Available | |
| Milem Michael J | $92,000 | -- |
Source: Public Records
Mortgage History
| Date | Status | Borrower | Loan Amount |
|---|---|---|---|
| Open | Hahn Eric Wesley | $57,200 | |
| Previous Owner | Milem Michael J | $91,104 |
Source: Public Records
Tax History Compared to Growth
Tax History
| Year | Tax Paid | Tax Assessment Tax Assessment Total Assessment is a certain percentage of the fair market value that is determined by local assessors to be the total taxable value of land and additions on the property. | Land | Improvement |
|---|---|---|---|---|
| 2025 | $3,029 | $266,780 | $60,000 | $206,780 |
| 2024 | $3,029 | $266,780 | $60,000 | $206,780 |
| 2023 | $1,950 | $142,350 | $33,000 | $109,350 |
| 2022 | $1,950 | $142,350 | $33,000 | $109,350 |
| 2021 | $1,950 | $142,350 | $33,000 | $109,350 |
| 2020 | $1,950 | $142,350 | $33,000 | $109,350 |
| 2019 | $1,423 | $103,860 | $20,400 | $83,460 |
| 2018 | $1,402 | $103,860 | $20,400 | $83,460 |
| 2017 | $1,381 | $103,860 | $20,400 | $83,460 |
| 2016 | $1,381 | $119,250 | $28,800 | $90,450 |
| 2015 | $1,503 | $119,250 | $28,800 | $90,450 |
| 2014 | $1,503 | $119,250 | $28,800 | $90,450 |
Source: Public Records
Map
Nearby Homes
- 1526 Shepard St
- 1406 Shepard St
- 311 Jean Ave
- 406 Ruth Ave
- 137 Beaumont Ave
- 1517 Jamaica Rd
- 2040 Brantley Creek Dr
- 141 Beaumont Ave
- 2010 Samantha Dr
- 314 N Little Texas Rd
- 1400 Central Dr
- 1102 Lane St
- 1905 Clay St
- 132 Kennedy Ave
- 712 Grace Ave
- 302 Melinda Ave
- 604 Pearl Ave
- 520 Wright Ave
- 807 Carolyn Ave
- 2122 Brantley Rd