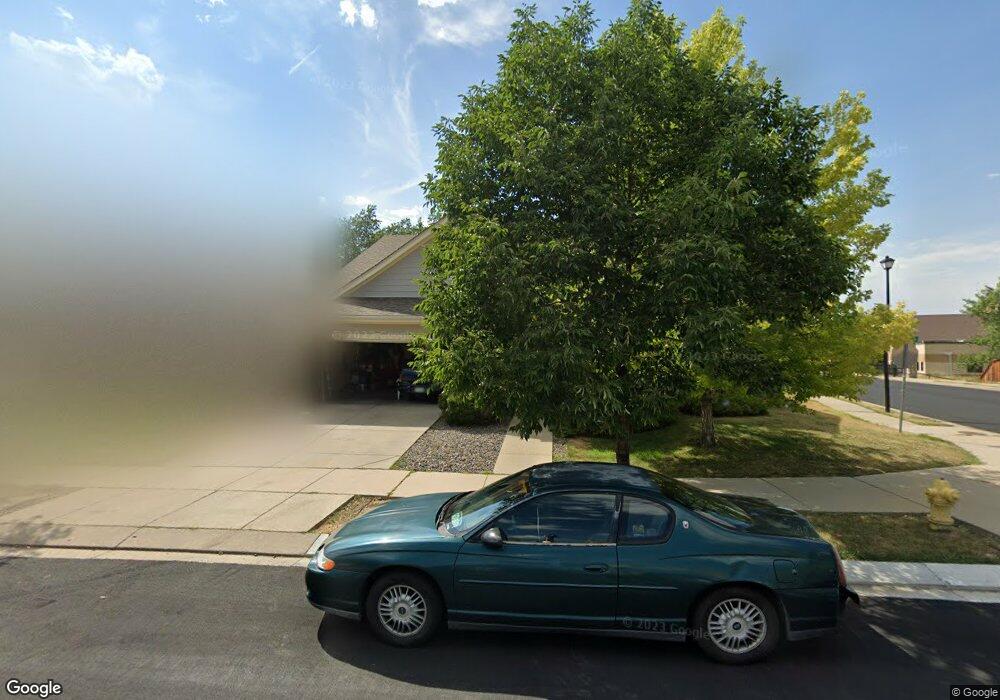
15395 E 7th Cir Aurora, CO 80011
Laredo Highline NeighborhoodEstimated Value: $486,508 - $581,000
3
Beds
2
Baths
2,708
Sq Ft
$200/Sq Ft
Est. Value
About This Home
This home is located at 15395 E 7th Cir, Aurora, CO 80011 and is currently estimated at $541,127, approximately $199 per square foot. 15395 E 7th Cir is a home located in Arapahoe County with nearby schools including Laredo Elementary School, East Middle School, and Hinkley High School.
Ownership History
Date
Name
Owned For
Owner Type
Purchase Details
Closed on
Jan 20, 2023
Sold by
Simmons Jacqueline
Bought by
Simmons Living Trust
Current Estimated Value
Purchase Details
Closed on
Jun 23, 2008
Sold by
U S Bank Na
Bought by
Simmons Jacqueline and Alshakhs Anwar A
Purchase Details
Closed on
Nov 14, 2006
Sold by
Rogers Bobby G
Bought by
Camarena Rosa M
Home Financials for this Owner
Home Financials are based on the most recent Mortgage that was taken out on this home.
Original Mortgage
$201,025
Interest Rate
6.99%
Mortgage Type
Purchase Money Mortgage
Purchase Details
Closed on
May 19, 2004
Sold by
Weekley Homes Lp
Bought by
Rogers Bobby G
Home Financials for this Owner
Home Financials are based on the most recent Mortgage that was taken out on this home.
Original Mortgage
$235,800
Interest Rate
6.62%
Mortgage Type
Purchase Money Mortgage
Create a Home Valuation Report for This Property
The Home Valuation Report is an in-depth analysis detailing your home's value as well as a comparison with similar homes in the area
Home Values in the Area
Average Home Value in this Area
Purchase History
| Date | Buyer | Sale Price | Title Company |
|---|---|---|---|
| Simmons Living Trust | -- | -- | |
| Simmons Jacqueline | $216,000 | Fahtco | |
| Camarena Rosa M | $236,500 | Fahtco | |
| Rogers Bobby G | $262,000 | North American Title |
Source: Public Records
Mortgage History
| Date | Status | Borrower | Loan Amount |
|---|---|---|---|
| Previous Owner | Camarena Rosa M | $201,025 | |
| Previous Owner | Rogers Bobby G | $235,800 |
Source: Public Records
Tax History
| Year | Tax Paid | Tax Assessment Tax Assessment Total Assessment is a certain percentage of the fair market value that is determined by local assessors to be the total taxable value of land and additions on the property. | Land | Improvement |
|---|---|---|---|---|
| 2025 | $3,255 | $33,463 | -- | -- |
| 2024 | $3,157 | $33,963 | -- | -- |
| 2023 | $3,157 | $33,963 | $0 | $0 |
| 2022 | $3,002 | $29,899 | $0 | $0 |
| 2021 | $3,099 | $29,899 | $0 | $0 |
| 2020 | $3,043 | $29,222 | $0 | $0 |
| 2019 | $3,026 | $29,222 | $0 | $0 |
| 2018 | $2,745 | $25,963 | $0 | $0 |
| 2017 | $2,388 | $25,963 | $0 | $0 |
| 2016 | $1,974 | $21,006 | $0 | $0 |
| 2015 | $1,905 | $21,006 | $0 | $0 |
| 2014 | $1,414 | $15,013 | $0 | $0 |
| 2013 | -- | $17,070 | $0 | $0 |
Source: Public Records
Map
Nearby Homes
- 681 Fraser St
- 608 Evanston St
- 808 Idalia St
- 1064 Chambers Ct Unit 108
- 15863 E 7th Ave
- 666 Kittredge St
- 15950 E 6th Ave
- 1053 N Joplin St Unit 1
- 1063 N Joplin St Unit 2
- 1074 N Joplin St Unit 5
- 337 Ivory Cir
- 752 Lewiston St
- 1014 Sable Blvd
- 16010 E 11th Ave
- 745 Mobile St
- 1575 N Sable Blvd
- 1221 Eagle St
- 141 Granby Way Unit A
- 757 Norfolk Way
- 15141 E Security Way
- 15385 E 7th Cir
- 15375 E 7th Cir
- 15407 E 7th Cir
- 15394 E 7th Cir
- 15396 E 7th Cir
- 15384 E 7th Cir
- 15365 E 7th Cir
- 15406 E 7th Cir
- 15417 E 7th Cir
- 15374 E 7th Cir
- 15355 E 7th Cir
- 751 Helena St
- 741 Helena St
- 15364 E 7th Cir
- 15437 E 7th Cir
- 761 Helena St
- 731 Helena St
- 750 Chambers Rd
- 15457 E 7th Cir
- 15345 E 7th Cir
Your Personal Tour Guide
Ask me questions while you tour the home.