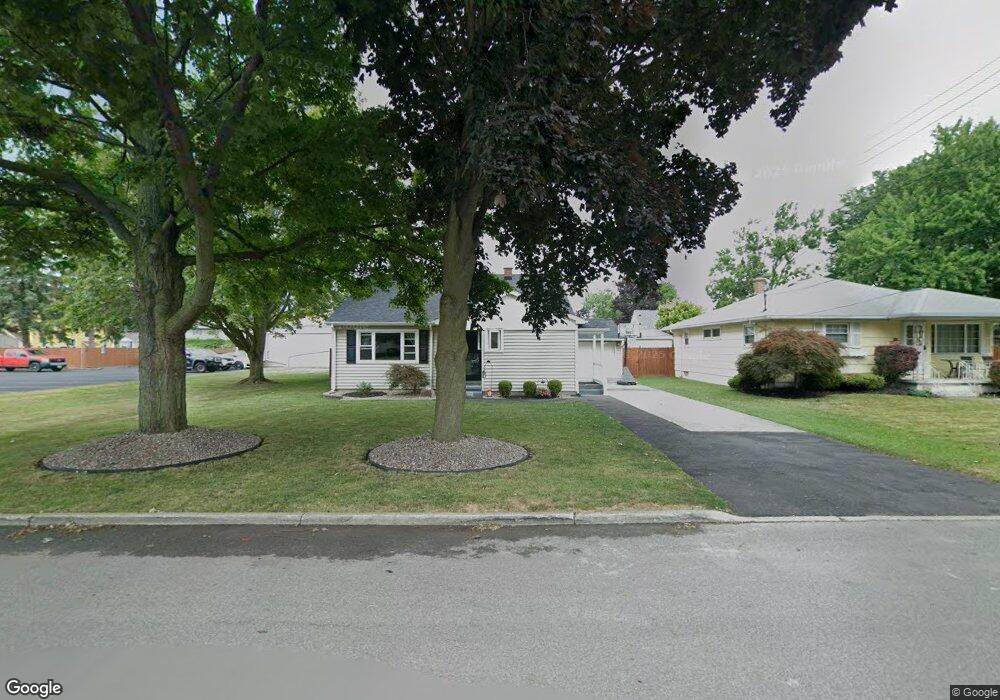
154 11th Ave North Tonawanda, NY 14120
Estimated Value: $202,000 - $261,907
3
Beds
2
Baths
1,136
Sq Ft
$211/Sq Ft
Est. Value
About This Home
This home is located at 154 11th Ave, North Tonawanda, NY 14120 and is currently estimated at $240,227, approximately $211 per square foot. 154 11th Ave is a home located in Niagara County with nearby schools including North Tonawanda Intermediate School, St Matthew Lutheran School, and St. John Lutheran School.
Ownership History
Date
Name
Owned For
Owner Type
Purchase Details
Closed on
Nov 9, 2009
Sold by
Najuch Roger
Bought by
Cassel Wesley
Current Estimated Value
Home Financials for this Owner
Home Financials are based on the most recent Mortgage that was taken out on this home.
Original Mortgage
$95,733
Outstanding Balance
$62,448
Interest Rate
5.06%
Mortgage Type
FHA
Estimated Equity
$177,779
Purchase Details
Closed on
Oct 22, 2009
Sold by
Najuch Florence and Najuch Roger M
Bought by
Cassel Wesley A and Cassel Jennifer
Home Financials for this Owner
Home Financials are based on the most recent Mortgage that was taken out on this home.
Original Mortgage
$95,733
Outstanding Balance
$62,448
Interest Rate
5.06%
Mortgage Type
FHA
Estimated Equity
$177,779
Purchase Details
Closed on
Jan 15, 2008
Sold by
Najuch Frank
Bought by
Najuch Roger-Deborah
Purchase Details
Closed on
Nov 1, 2007
Sold by
Najuch Florence
Bought by
Najuch Florence
Create a Home Valuation Report for This Property
The Home Valuation Report is an in-depth analysis detailing your home's value as well as a comparison with similar homes in the area
Home Values in the Area
Average Home Value in this Area
Purchase History
| Date | Buyer | Sale Price | Title Company |
|---|---|---|---|
| Cassel Wesley | $97,500 | Nancy Saia | |
| Cassel Wesley A | $97,500 | None Available | |
| Najuch Roger-Deborah | -- | Hogan & Willig | |
| Najuch Florence | -- | Hogan & Willig |
Source: Public Records
Mortgage History
| Date | Status | Borrower | Loan Amount |
|---|---|---|---|
| Open | Cassel Wesley A | $95,733 |
Source: Public Records
Tax History Compared to Growth
Tax History
| Year | Tax Paid | Tax Assessment Tax Assessment Total Assessment is a certain percentage of the fair market value that is determined by local assessors to be the total taxable value of land and additions on the property. | Land | Improvement |
|---|---|---|---|---|
| 2024 | $3,315 | $93,900 | $15,600 | $78,300 |
| 2023 | $3,233 | $93,900 | $15,600 | $78,300 |
| 2022 | $2,679 | $93,900 | $15,600 | $78,300 |
| 2021 | $2,468 | $86,900 | $15,600 | $71,300 |
| 2020 | $2,369 | $86,900 | $15,600 | $71,300 |
| 2019 | $2,241 | $86,900 | $15,600 | $71,300 |
| 2018 | $2,302 | $86,900 | $15,600 | $71,300 |
| 2017 | $2,241 | $86,900 | $15,600 | $71,300 |
| 2016 | $2,168 | $86,900 | $15,600 | $71,300 |
| 2015 | -- | $86,900 | $15,600 | $71,300 |
| 2014 | -- | $86,900 | $15,600 | $71,300 |
Source: Public Records
Map
Nearby Homes