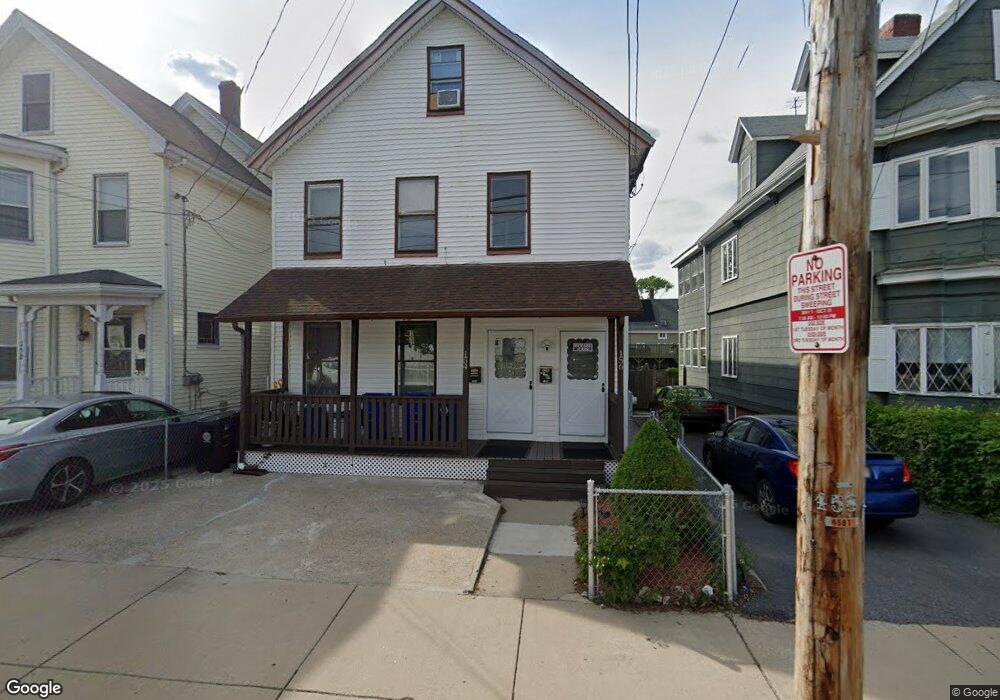
154 Belmont St Unit 156 Malden, MA 02148
Belmont NeighborhoodEstimated Value: $851,085 - $1,135,000
8
Beds
2
Baths
2,165
Sq Ft
$455/Sq Ft
Est. Value
About This Home
This home is located at 154 Belmont St Unit 156, Malden, MA 02148 and is currently estimated at $986,021, approximately $455 per square foot. 154 Belmont St Unit 156 is a home located in Middlesex County with nearby schools including Malden High School and Pioneer Charter School of Science.
Ownership History
Date
Name
Owned For
Owner Type
Purchase Details
Closed on
Oct 17, 2007
Sold by
Tejada Ana and Tejada Fredy A
Bought by
Tejada Ana Cecilia and Tejada Fredy A
Current Estimated Value
Purchase Details
Closed on
Jul 1, 2004
Sold by
Prado Mariza T and Estrada Santos J
Bought by
Tejada Ana and Tejada Fredy A
Home Financials for this Owner
Home Financials are based on the most recent Mortgage that was taken out on this home.
Original Mortgage
$440,000
Interest Rate
6.3%
Mortgage Type
Purchase Money Mortgage
Purchase Details
Closed on
May 30, 2000
Sold by
Brown Olive Est and Cloutman Diane
Bought by
Estrada Santos J and Prado Mariza T
Home Financials for this Owner
Home Financials are based on the most recent Mortgage that was taken out on this home.
Original Mortgage
$189,900
Interest Rate
8.1%
Mortgage Type
Purchase Money Mortgage
Create a Home Valuation Report for This Property
The Home Valuation Report is an in-depth analysis detailing your home's value as well as a comparison with similar homes in the area
Home Values in the Area
Average Home Value in this Area
Purchase History
| Date | Buyer | Sale Price | Title Company |
|---|---|---|---|
| Tejada Ana Cecilia | -- | -- | |
| Tejada Ana | $488,900 | -- | |
| Estrada Santos J | $199,900 | -- |
Source: Public Records
Mortgage History
| Date | Status | Borrower | Loan Amount |
|---|---|---|---|
| Previous Owner | Tejada Ana | $440,000 | |
| Previous Owner | Estrada Santos J | $189,900 |
Source: Public Records
Tax History Compared to Growth
Tax History
| Year | Tax Paid | Tax Assessment Tax Assessment Total Assessment is a certain percentage of the fair market value that is determined by local assessors to be the total taxable value of land and additions on the property. | Land | Improvement |
|---|---|---|---|---|
| 2025 | $88 | $773,100 | $269,300 | $503,800 |
| 2024 | $8,521 | $728,900 | $254,300 | $474,600 |
| 2023 | $8,262 | $677,800 | $231,900 | $445,900 |
| 2022 | $7,909 | $640,400 | $209,400 | $431,000 |
| 2021 | $7,595 | $618,000 | $187,000 | $431,000 |
| 2020 | $7,346 | $580,700 | $180,600 | $400,100 |
| 2019 | $6,894 | $519,500 | $172,000 | $347,500 |
| 2018 | $6,615 | $469,500 | $142,100 | $327,400 |
| 2017 | $6,232 | $439,800 | $136,500 | $303,300 |
| 2016 | $5,703 | $376,200 | $125,300 | $250,900 |
| 2015 | $5,507 | $350,100 | $119,300 | $230,800 |
| 2014 | $5,171 | $321,200 | $108,500 | $212,700 |
Source: Public Records
Map
Nearby Homes
- 210 Hancock St
- 98 Bradford St
- 32 Central Ave
- 16 Boylston St
- 55 Clarendon St
- 21 Central Ave Unit 10
- 72 Ashland St Unit 307
- 21 Staples Ave Unit 25
- 17 Ashton St
- 13-15 Benner Ave
- 15 Staples Ave Unit 31
- 12 Woodland St Unit 12
- 28 Vernal St
- 103 Swan St
- 4 Cross St Unit 1
- 89 Judson St
- 17 Garland Ave
- 80 Main St Unit 9
- 272-274 Cross St Unit 1
- 272-274 Cross St Unit 4
- 152 Belmont St
- 150 Belmont St
- 158 Belmont St Unit 160
- 162 Belmont St Unit 164
- 155 Belmont St
- 11 Fairmont Ct
- 18 Fairmont Terrace
- 146 Belmont St
- 161 Belmont St
- 149 Belmont St
- 149 Belmont St Unit 2
- 12 Fairmont Ct
- 12 Fairmont Terrace
- 145 Belmont St
- 14 Fairmont Place Unit 16
- 14-16 Fairmont Place
- 14-16 Fairmont Place Unit 2
- 14 Fairmont Place Unit 1
- 138 Belmont St Unit 140
- 9 Fairmont Place Unit 11