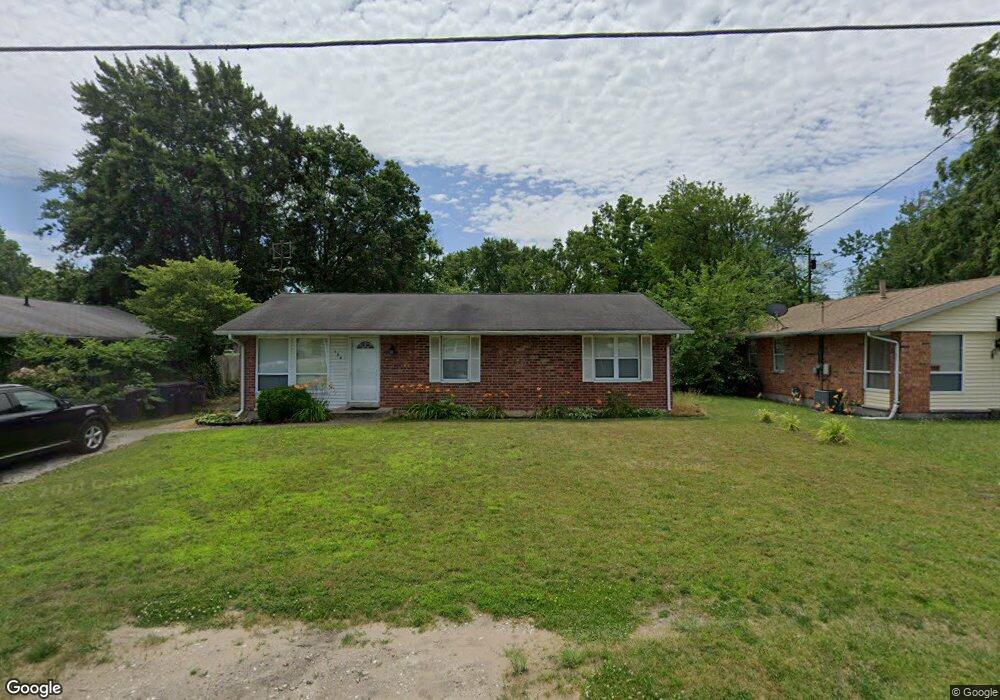
154 Chestnut St Michigan City, IN 46360
Estimated Value: $148,097 - $171,000
3
Beds
2
Baths
918
Sq Ft
$175/Sq Ft
Est. Value
About This Home
This home is located at 154 Chestnut St, Michigan City, IN 46360 and is currently estimated at $160,774, approximately $175 per square foot. 154 Chestnut St is a home located in LaPorte County with nearby schools including Knapp Elementary School, Barker Middle School, and Michigan City High School.
Ownership History
Date
Name
Owned For
Owner Type
Purchase Details
Closed on
Jun 15, 2010
Sold by
Buckner Floyd
Bought by
Ast Brian
Current Estimated Value
Home Financials for this Owner
Home Financials are based on the most recent Mortgage that was taken out on this home.
Original Mortgage
$71,677
Outstanding Balance
$47,564
Interest Rate
4.77%
Mortgage Type
FHA
Estimated Equity
$113,210
Purchase Details
Closed on
Dec 29, 2009
Sold by
The Bank Of New York Mellon Trust Compan
Bought by
Buckner Floyd
Purchase Details
Closed on
Aug 6, 2009
Sold by
Nixon Kieasha D
Bought by
The Bank Of New York Mellon Trust Compan and The Bank Of New York Trust Company Na
Create a Home Valuation Report for This Property
The Home Valuation Report is an in-depth analysis detailing your home's value as well as a comparison with similar homes in the area
Home Values in the Area
Average Home Value in this Area
Purchase History
| Date | Buyer | Sale Price | Title Company |
|---|---|---|---|
| Ast Brian | -- | Meridian Title Corp | |
| Buckner Floyd | -- | Royal Title Services Inc | |
| The Bank Of New York Mellon Trust Compan | $76,075 | None Available |
Source: Public Records
Mortgage History
| Date | Status | Borrower | Loan Amount |
|---|---|---|---|
| Open | Ast Brian | $71,677 |
Source: Public Records
Tax History Compared to Growth
Tax History
| Year | Tax Paid | Tax Assessment Tax Assessment Total Assessment is a certain percentage of the fair market value that is determined by local assessors to be the total taxable value of land and additions on the property. | Land | Improvement |
|---|---|---|---|---|
| 2024 | $753 | $79,400 | $6,600 | $72,800 |
| 2022 | $619 | $79,400 | $6,600 | $72,800 |
| 2021 | $619 | $73,600 | $6,600 | $67,000 |
| 2020 | $626 | $73,600 | $6,600 | $67,000 |
| 2019 | $935 | $88,700 | $13,500 | $75,200 |
| 2018 | $845 | $80,900 | $9,100 | $71,800 |
| 2017 | $736 | $76,800 | $9,100 | $67,700 |
| 2016 | $641 | $74,400 | $7,600 | $66,800 |
| 2014 | $719 | $79,900 | $7,600 | $72,300 |
Source: Public Records
Map
Nearby Homes