Estimated Value: $350,000 - $384,000
3
Beds
3
Baths
2,009
Sq Ft
$180/Sq Ft
Est. Value
About This Home
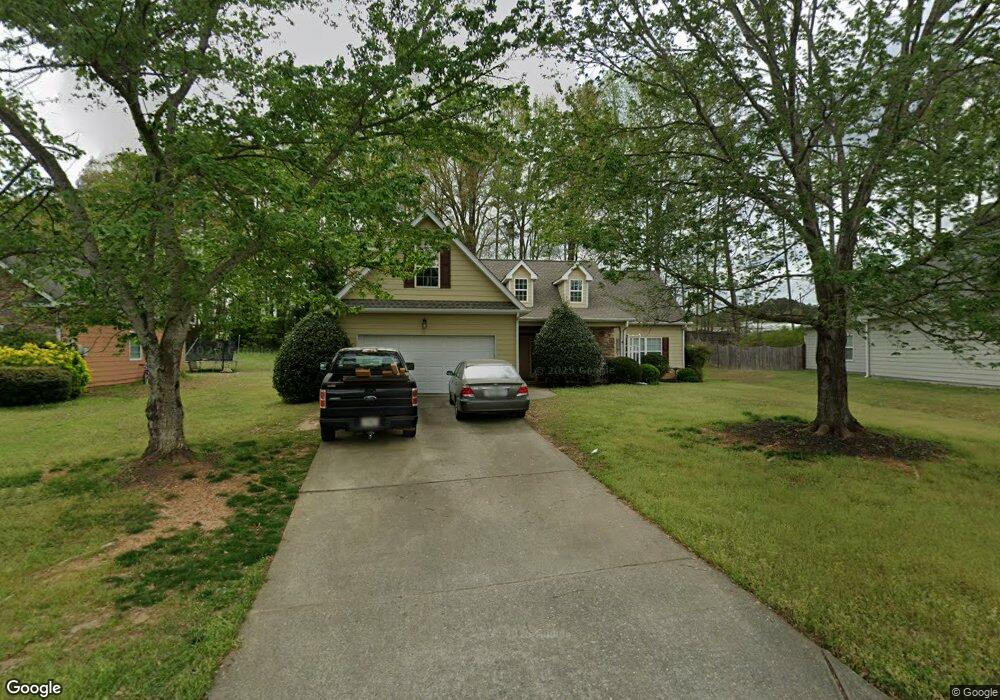
This home is located at 154 Clairidge Cir, Hiram, GA 30141 and is currently estimated at $360,626, approximately $179 per square foot. 154 Clairidge Cir is a home located in Paulding County with nearby schools including Hiram Elementary School, P. B. Ritch Middle School, and Hiram High School.
Ownership History
Date
Name
Owned For
Owner Type
Purchase Details
Closed on
Jan 13, 2010
Sold by
Reynolds Paul A
Bought by
Reynolds Paul A and Weir Kathy
Current Estimated Value
Purchase Details
Closed on
Nov 16, 2007
Sold by
Wiley Edward E
Bought by
Reynolds Paul
Home Financials for this Owner
Home Financials are based on the most recent Mortgage that was taken out on this home.
Original Mortgage
$177,693
Interest Rate
6.36%
Mortgage Type
VA
Purchase Details
Closed on
Jun 30, 2005
Sold by
David Shepherd Construction Inc
Bought by
Wiley Edward E
Home Financials for this Owner
Home Financials are based on the most recent Mortgage that was taken out on this home.
Original Mortgage
$193,400
Interest Rate
5.88%
Mortgage Type
New Conventional
Purchase Details
Closed on
Apr 12, 2005
Sold by
Castlebrook Development Inc
Purchase Details
Closed on
Apr 14, 2004
Sold by
Menlow Station Development Llc
Create a Home Valuation Report for This Property
The Home Valuation Report is an in-depth analysis detailing your home's value as well as a comparison with similar homes in the area
Home Values in the Area
Average Home Value in this Area
Purchase History
| Date | Buyer | Sale Price | Title Company |
|---|---|---|---|
| Reynolds Paul A | -- | -- | |
| Reynolds Paul | $195,000 | -- | |
| Wiley Edward E | $193,400 | -- | |
| -- | $193,400 | -- | |
| -- | $183,000 | -- | |
| -- | $42,000 | -- |
Source: Public Records
Mortgage History
| Date | Status | Borrower | Loan Amount |
|---|---|---|---|
| Previous Owner | Reynolds Paul | $177,693 | |
| Previous Owner | -- | $193,400 |
Source: Public Records
Tax History
| Year | Tax Paid | Tax Assessment Tax Assessment Total Assessment is a certain percentage of the fair market value that is determined by local assessors to be the total taxable value of land and additions on the property. | Land | Improvement |
|---|---|---|---|---|
| 2025 | $1,019 | $150,273 | $13,168 | $137,105 |
| 2024 | $1,020 | $150,273 | $13,168 | $137,105 |
| 2023 | $1,280 | $159,828 | $14,000 | $145,828 |
| 2022 | $715 | $89,968 | $13,066 | $76,902 |
| 2021 | $886 | $89,968 | $13,066 | $76,902 |
| 2020 | $1,691 | $89,968 | $14,000 | $75,968 |
| 2019 | $1,372 | $72,800 | $13,293 | $59,507 |
| 2018 | $1,367 | $72,800 | $13,293 | $59,507 |
| 2017 | $1,472 | $76,400 | $14,000 | $62,400 |
| 2016 | $1,141 | $61,600 | $14,000 | $47,600 |
| 2015 | $1,839 | $61,600 | $14,000 | $47,600 |
| 2014 | $1,882 | $61,480 | $14,000 | $47,480 |
| 2013 | -- | $44,000 | $14,000 | $30,000 |
Source: Public Records
Map
Nearby Homes
- 1779 Cleburne Pkwy
- 3225 Warren Creek Dr
- 965 Angham Rd
- 3160 Woodberry Farm Ln
- 54 Jean Ct
- 3204 Creek Trace W
- 5223 Mourning Dove Way SW
- 1241 Silvercrest Ct
- 1261 Silvercrest Ct SW
- 00001 Bill Carruth Pkwy
- 1276 Silvercrest Ct
- 00 Bill Carruth Pkwy
- 0 Bill Carruth Pkwy Unit 10673923
- 1520 Silver Mist Cir
- 1513 Silver Mist Cir
- 5764 Tillman Way
- 5691 Tillman Way
- 5772 Tillman Way
- 5620 Tillman Way
- 5719 Tillman Way
- 164 Clairidge Cir
- 144 Clairidge Cir
- 128 Clairidge Cir
- 18 Parklin Trail
- 40 Braemore Ct
- 30 Braemore Ct
- 14 Braemore Ct
- 165 Clairidge Cir
- 110 Clairidge Cir
- 181 Clairidge Cir
- 197 Clairidge Cir
- 113 Clairidge Cir
- 46 Braemore Ct
- 100 Clairidge Cir
- 11 Braemore Ct
- 37 Parklin Trail
- 87 Clairidge Cir
- 211 Clairidge Cir
- 43 Braemore Ct
- 31 Braemore Ct
Your Personal Tour Guide
Ask me questions while you tour the home.