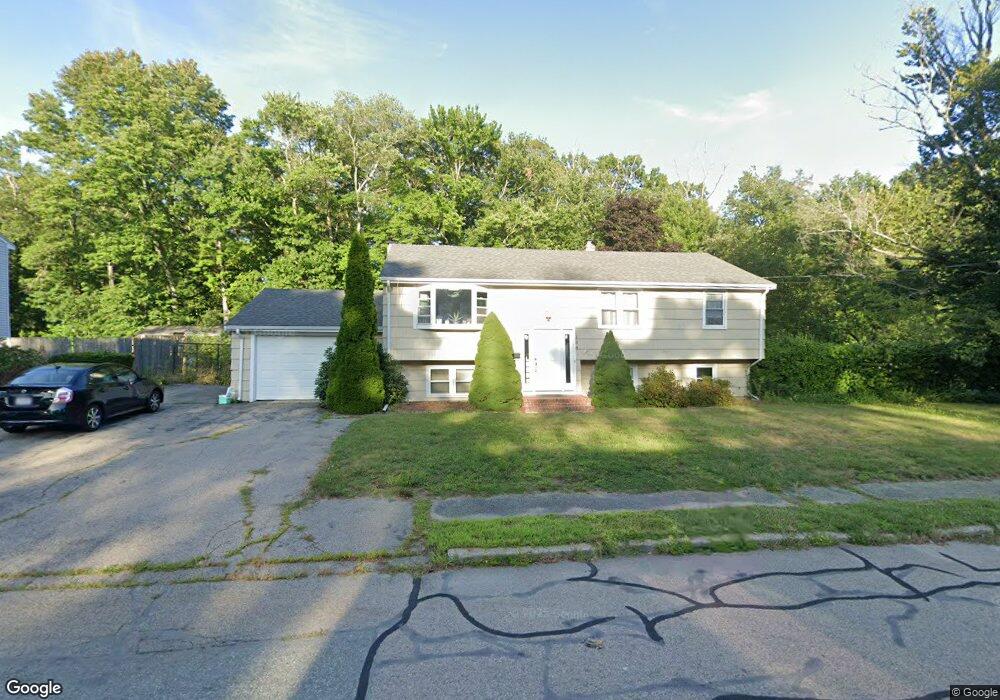
154 Damon Rd Rockland, MA 02370
Estimated Value: $549,000 - $709,000
3
Beds
2
Baths
2,618
Sq Ft
$251/Sq Ft
Est. Value
About This Home
This home is located at 154 Damon Rd, Rockland, MA 02370 and is currently estimated at $657,758, approximately $251 per square foot. 154 Damon Rd is a home located in Plymouth County with nearby schools including Rockland Senior High School, Calvary Chapel Academy, and Holy Family Elementary School.
Ownership History
Date
Name
Owned For
Owner Type
Purchase Details
Closed on
Nov 1, 2016
Sold by
Johnson Charles N and Johnson Linda J
Bought by
Pisano Kaitlin
Current Estimated Value
Home Financials for this Owner
Home Financials are based on the most recent Mortgage that was taken out on this home.
Original Mortgage
$242,250
Outstanding Balance
$194,974
Interest Rate
3.5%
Mortgage Type
New Conventional
Estimated Equity
$462,784
Purchase Details
Closed on
Jul 12, 1989
Sold by
Falco Vincent
Bought by
Johnson Charles N
Home Financials for this Owner
Home Financials are based on the most recent Mortgage that was taken out on this home.
Original Mortgage
$132,700
Interest Rate
10.39%
Mortgage Type
Purchase Money Mortgage
Create a Home Valuation Report for This Property
The Home Valuation Report is an in-depth analysis detailing your home's value as well as a comparison with similar homes in the area
Home Values in the Area
Average Home Value in this Area
Purchase History
| Date | Buyer | Sale Price | Title Company |
|---|---|---|---|
| Pisano Kaitlin | $255,000 | -- | |
| Johnson Charles N | $177,500 | -- |
Source: Public Records
Mortgage History
| Date | Status | Borrower | Loan Amount |
|---|---|---|---|
| Open | Pisano Kaitlin | $242,250 | |
| Previous Owner | Johnson Charles N | $31,500 | |
| Previous Owner | Johnson Charles N | $34,300 | |
| Previous Owner | Johnson Charles N | $22,000 | |
| Previous Owner | Johnson Charles N | $132,700 |
Source: Public Records
Tax History Compared to Growth
Tax History
| Year | Tax Paid | Tax Assessment Tax Assessment Total Assessment is a certain percentage of the fair market value that is determined by local assessors to be the total taxable value of land and additions on the property. | Land | Improvement |
|---|---|---|---|---|
| 2025 | $7,159 | $523,700 | $227,100 | $296,600 |
| 2024 | $7,008 | $498,400 | $214,200 | $284,200 |
| 2023 | $6,787 | $445,900 | $196,500 | $249,400 |
| 2022 | $6,613 | $394,800 | $170,900 | $223,900 |
| 2021 | $3 | $349,900 | $155,300 | $194,600 |
| 2020 | $5,835 | $333,400 | $147,900 | $185,500 |
| 2019 | $5,695 | $317,800 | $140,900 | $176,900 |
| 2018 | $4 | $301,500 | $140,900 | $160,600 |
| 2017 | $4 | $301,900 | $140,900 | $161,000 |
| 2016 | $5,369 | $290,400 | $135,500 | $154,900 |
| 2015 | $5,125 | $269,300 | $126,600 | $142,700 |
| 2014 | $4,761 | $259,600 | $124,200 | $135,400 |
Source: Public Records
Map
Nearby Homes