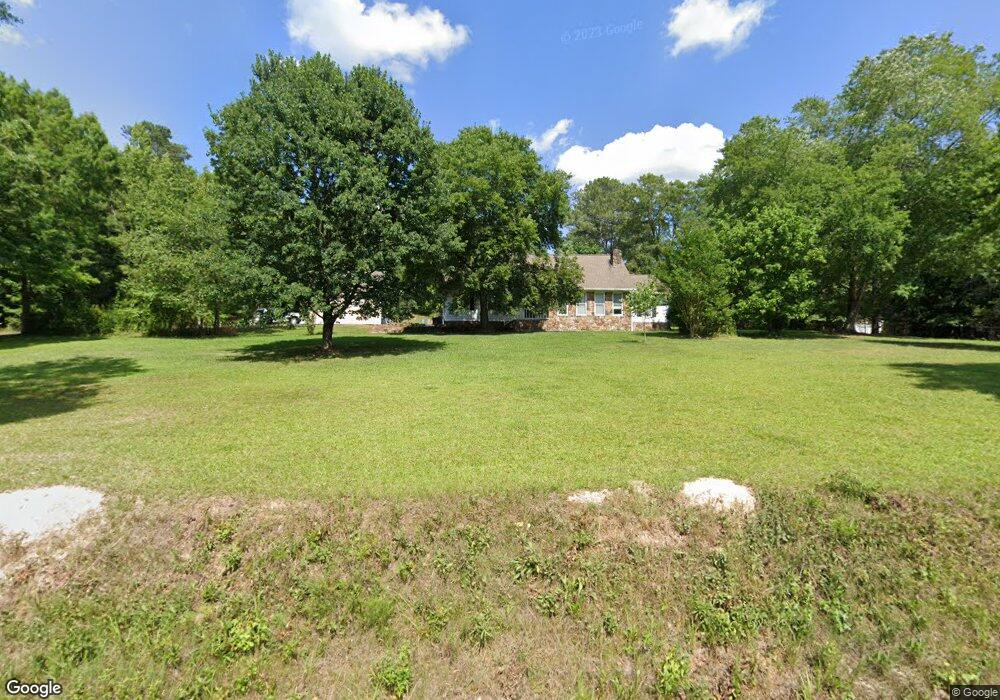
154 Fulton Rd Kingston, GA 30145
Estimated Value: $362,000 - $525,000
--
Bed
1
Bath
2,213
Sq Ft
$193/Sq Ft
Est. Value
About This Home
This home is located at 154 Fulton Rd, Kingston, GA 30145 and is currently estimated at $426,107, approximately $192 per square foot. 154 Fulton Rd is a home located in Floyd County with nearby schools including Model Middle School and Model High School.
Ownership History
Date
Name
Owned For
Owner Type
Purchase Details
Closed on
Aug 15, 2012
Sold by
Federal National Mortgage Association
Bought by
Alden John W and Alden Phyllis
Current Estimated Value
Purchase Details
Closed on
Jul 9, 2012
Sold by
Wells Fargo Bank Na
Bought by
Federal National Mortgage Association
Purchase Details
Closed on
Jun 5, 2012
Sold by
Behr Michael J
Bought by
Wells Fargo Bank
Purchase Details
Closed on
Feb 15, 2008
Sold by
Not Provided
Bought by
Behr Behr Michael J Michael J and Behr Sheila K
Home Financials for this Owner
Home Financials are based on the most recent Mortgage that was taken out on this home.
Original Mortgage
$195,000
Interest Rate
5.65%
Mortgage Type
New Conventional
Purchase Details
Closed on
Aug 19, 2004
Bought by
P and R
Purchase Details
Closed on
May 21, 2004
Sold by
Garrard John L and Garrard Winfred M
Bought by
Meadows W D
Purchase Details
Closed on
Jun 6, 1995
Bought by
Garrard John L and Garr Winfred M
Create a Home Valuation Report for This Property
The Home Valuation Report is an in-depth analysis detailing your home's value as well as a comparison with similar homes in the area
Home Values in the Area
Average Home Value in this Area
Purchase History
| Date | Buyer | Sale Price | Title Company |
|---|---|---|---|
| Alden John W | $139,000 | -- | |
| Federal National Mortgage Association | -- | -- | |
| Wells Fargo Bank | $207,047 | -- | |
| Behr Behr Michael J Michael J | $195,000 | -- | |
| Behr Michael J | $195,000 | -- | |
| P | -- | -- | |
| Meadows W D | $50,000 | -- | |
| Garrard John L | -- | -- |
Source: Public Records
Mortgage History
| Date | Status | Borrower | Loan Amount |
|---|---|---|---|
| Previous Owner | Behr Michael J | $195,000 |
Source: Public Records
Tax History Compared to Growth
Tax History
| Year | Tax Paid | Tax Assessment Tax Assessment Total Assessment is a certain percentage of the fair market value that is determined by local assessors to be the total taxable value of land and additions on the property. | Land | Improvement |
|---|---|---|---|---|
| 2024 | $2,213 | $135,496 | $19,336 | $116,160 |
| 2023 | $1,883 | $115,308 | $17,578 | $97,730 |
| 2022 | $1,571 | $94,829 | $14,615 | $80,214 |
| 2021 | $1,249 | $75,651 | $13,245 | $62,406 |
| 2020 | $1,076 | $65,496 | $11,518 | $53,978 |
| 2019 | $1,010 | $62,972 | $11,518 | $51,454 |
| 2018 | $953 | $59,740 | $10,971 | $48,769 |
| 2017 | $766 | $52,029 | $10,159 | $41,870 |
| 2016 | $760 | $51,205 | $10,120 | $41,085 |
| 2015 | $721 | $51,205 | $10,120 | $41,085 |
| 2014 | $721 | $51,205 | $10,120 | $41,085 |
Source: Public Records
Map
Nearby Homes
- 291 Youngs Mill Rd
- 370 Youngs Mill Rd
- 981 Youngs Mill Rd
- 96 Collins Rd NE
- 1849 Morrison Camp Ground Rd NE
- 145 Wiseman Rd
- 0 Mcclain Rd Unit 10537234
- 127 Branson Rd SE
- 87 Ward Mountain Rd
- 175 Tom Jones Rd
- 158 Sproull Rd SE
- 818 Morrison Camp Ground Rd NE
- 19 Stratford Way
- 25 Stratford Way
- 0 Mountain Creek Dr SE Unit 10436191
- 169 Barnsley Church Rd
- 7 Trimble Way SE
- 567 Fred Kelley Rd NE
- 8 Trimble Way SE
- 154 Fulton Rd
- 142 Fulton Rd
- 190 Fulton Rd
- 0 Brewer Rd Unit 4
- 0 Brewer Rd Unit 4 7129189
- 0 Brewer Rd Unit 3096485
- 0 Brewer Rd Unit 3203847
- 0 Brewer Rd Unit 7044668
- 0 Brewer Rd Unit 7098394
- 0 Brewer Rd Unit 7145370
- 0 Brewer Rd Unit 7249037
- 0 Brewer Rd Unit 7347236
- 0 Brewer Rd Unit 7549377
- 0 Brewer Rd Unit 8191170
- 0 Brewer Rd Unit 8412602
- 230 Fulton Rd
- 230 Fulton Rd NE
- 7 Golden Way
- 13 Golden Way
- 11 Golden Way