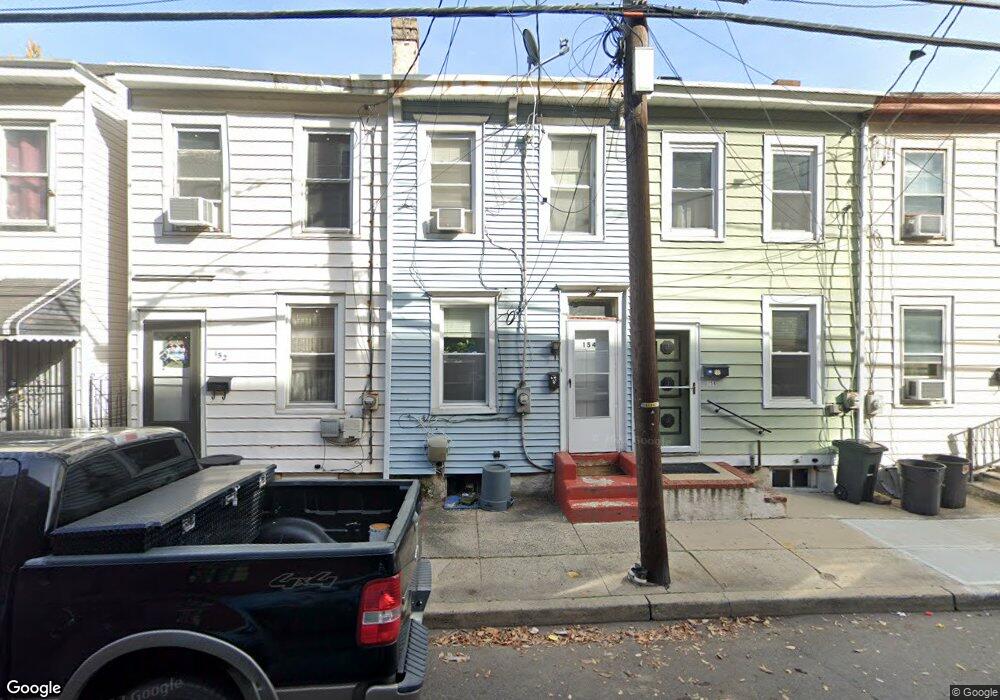
154 Hancock St Trenton, NJ 08611
South Trenton NeighborhoodEstimated Value: $132,935 - $157,000
--
Bed
--
Bath
768
Sq Ft
$192/Sq Ft
Est. Value
About This Home
This home is located at 154 Hancock St, Trenton, NJ 08611 and is currently estimated at $147,234, approximately $191 per square foot. 154 Hancock St is a home located in Mercer County with nearby schools including Mott Elementary School, Parker Elementary School, and Dr. Crosby Copeland Elementary School.
Ownership History
Date
Name
Owned For
Owner Type
Purchase Details
Closed on
Jan 4, 2012
Sold by
Fuhrer Phillip
Bought by
Jnh Funding Corp
Current Estimated Value
Purchase Details
Closed on
Aug 20, 2003
Sold by
Sheriff Of The County Of Merce
Bought by
Federal National Mortgage Association
Purchase Details
Closed on
Sep 22, 2000
Sold by
Yanno Matilda
Bought by
Velez William and Velez Lynne
Home Financials for this Owner
Home Financials are based on the most recent Mortgage that was taken out on this home.
Original Mortgage
$46,800
Interest Rate
7.89%
Create a Home Valuation Report for This Property
The Home Valuation Report is an in-depth analysis detailing your home's value as well as a comparison with similar homes in the area
Home Values in the Area
Average Home Value in this Area
Purchase History
| Date | Buyer | Sale Price | Title Company |
|---|---|---|---|
| Jnh Funding Corp | $136 | None Available | |
| Federal National Mortgage Association | -- | -- | |
| Velez William | $52,000 | -- |
Source: Public Records
Mortgage History
| Date | Status | Borrower | Loan Amount |
|---|---|---|---|
| Previous Owner | Velez William | $46,800 |
Source: Public Records
Tax History Compared to Growth
Tax History
| Year | Tax Paid | Tax Assessment Tax Assessment Total Assessment is a certain percentage of the fair market value that is determined by local assessors to be the total taxable value of land and additions on the property. | Land | Improvement |
|---|---|---|---|---|
| 2025 | $2,059 | $35,500 | $8,400 | $27,100 |
| 2024 | $1,976 | $35,500 | $8,400 | $27,100 |
| 2023 | $1,976 | $35,500 | $8,400 | $27,100 |
| 2022 | $1,938 | $35,500 | $8,400 | $27,100 |
| 2021 | $1,971 | $35,500 | $8,400 | $27,100 |
| 2020 | $1,965 | $35,500 | $8,400 | $27,100 |
| 2019 | $1,933 | $35,500 | $8,400 | $27,100 |
| 2018 | $1,851 | $35,500 | $8,400 | $27,100 |
| 2017 | $1,759 | $35,500 | $8,400 | $27,100 |
| 2016 | $2,422 | $42,100 | $14,700 | $27,400 |
| 2015 | $2,414 | $42,100 | $14,700 | $27,400 |
| 2014 | $2,402 | $42,100 | $14,700 | $27,400 |
Source: Public Records
Map
Nearby Homes