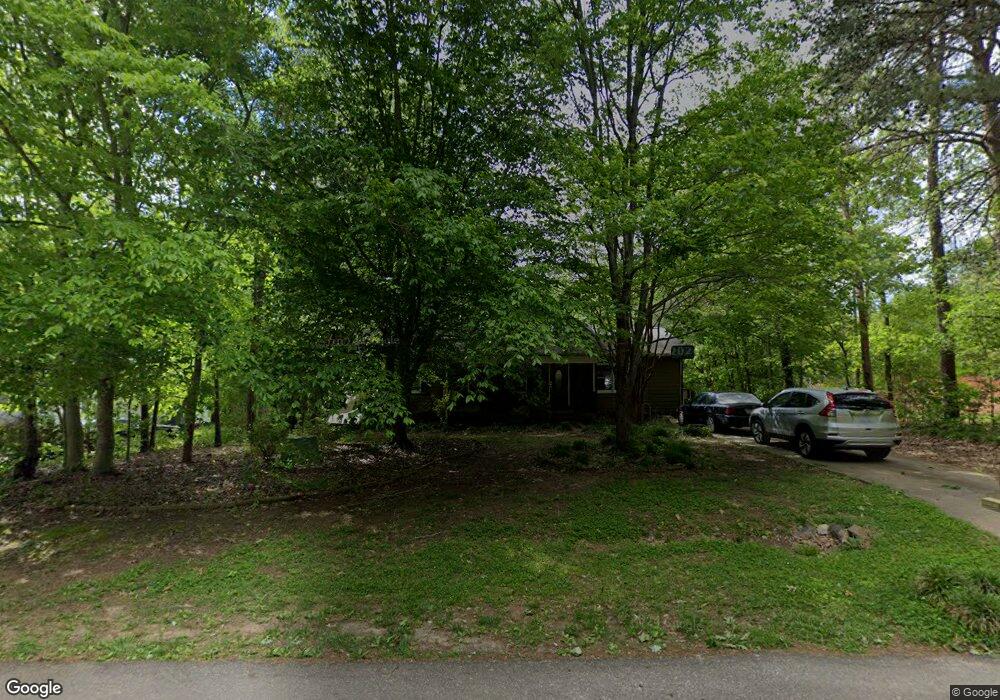
154 Levo Dr Troutman, NC 28166
Estimated Value: $314,314 - $330,000
3
Beds
2
Baths
1,550
Sq Ft
$208/Sq Ft
Est. Value
About This Home
This home is located at 154 Levo Dr, Troutman, NC 28166 and is currently estimated at $321,829, approximately $207 per square foot. 154 Levo Dr is a home located in Iredell County with nearby schools including Troutman Elementary School, Troutman Middle School, and South Iredell High School.
Ownership History
Date
Name
Owned For
Owner Type
Purchase Details
Closed on
Aug 31, 2006
Sold by
Pritchard Linda Joyce and Wierman Duncan
Bought by
Madison Cathleen J
Current Estimated Value
Home Financials for this Owner
Home Financials are based on the most recent Mortgage that was taken out on this home.
Original Mortgage
$99,400
Outstanding Balance
$58,765
Interest Rate
6.67%
Mortgage Type
Purchase Money Mortgage
Estimated Equity
$263,064
Purchase Details
Closed on
Jul 31, 2001
Sold by
Barry Michael S and Barry Helene G
Bought by
Pritchard Linda Joyce
Home Financials for this Owner
Home Financials are based on the most recent Mortgage that was taken out on this home.
Original Mortgage
$119,900
Interest Rate
12.65%
Purchase Details
Closed on
Aug 1, 1992
Purchase Details
Closed on
Nov 1, 1991
Purchase Details
Closed on
Jan 1, 1988
Create a Home Valuation Report for This Property
The Home Valuation Report is an in-depth analysis detailing your home's value as well as a comparison with similar homes in the area
Home Values in the Area
Average Home Value in this Area
Purchase History
| Date | Buyer | Sale Price | Title Company |
|---|---|---|---|
| Madison Cathleen J | $142,000 | None Available | |
| Pritchard Linda Joyce | $119,900 | -- | |
| -- | $77,000 | -- | |
| -- | $7,000 | -- | |
| -- | -- | -- |
Source: Public Records
Mortgage History
| Date | Status | Borrower | Loan Amount |
|---|---|---|---|
| Open | Madison Cathleen J | $99,400 | |
| Closed | Madison Cathleen J | $35,500 | |
| Previous Owner | Pritchard Linda Joyce | $119,900 |
Source: Public Records
Tax History
| Year | Tax Paid | Tax Assessment Tax Assessment Total Assessment is a certain percentage of the fair market value that is determined by local assessors to be the total taxable value of land and additions on the property. | Land | Improvement |
|---|---|---|---|---|
| 2025 | $1,594 | $255,640 | $30,000 | $225,640 |
| 2024 | $1,594 | $255,640 | $30,000 | $225,640 |
| 2023 | $1,594 | $255,640 | $30,000 | $225,640 |
| 2022 | $1,117 | $165,810 | $28,000 | $137,810 |
| 2021 | $1,096 | $165,810 | $28,000 | $137,810 |
| 2020 | $1,096 | $165,810 | $28,000 | $137,810 |
| 2019 | $1,055 | $165,810 | $28,000 | $137,810 |
| 2018 | $888 | $139,910 | $27,000 | $112,910 |
| 2017 | $888 | $139,910 | $27,000 | $112,910 |
| 2016 | $888 | $139,910 | $27,000 | $112,910 |
| 2015 | $888 | $139,910 | $27,000 | $112,910 |
| 2014 | -- | $149,260 | $27,000 | $122,260 |
Source: Public Records
Map
Nearby Homes
- 129-131 Shermill Ln
- 551 Perry Rd
- 157 Byers Rd
- 340 Field Dr
- 131 Autumn Leaf Rd
- 276 Ostwalt Amity Rd
- 150 Autumn Leaf Rd
- 173 Painted Bunting Dr
- 221 Astor St
- 218 Astor St
- 217 Astor St
- 214 Astor St
- 213 Cassius Dr
- 339 S Eastway Dr
- 124 Falls Leaf Dr
- 210 Astor St
- 203 Cassius Dr
- 228 Cassius Dr
- 207 Cassius Dr
- 126 Gilcrest Ln
Your Personal Tour Guide
Ask me questions while you tour the home.