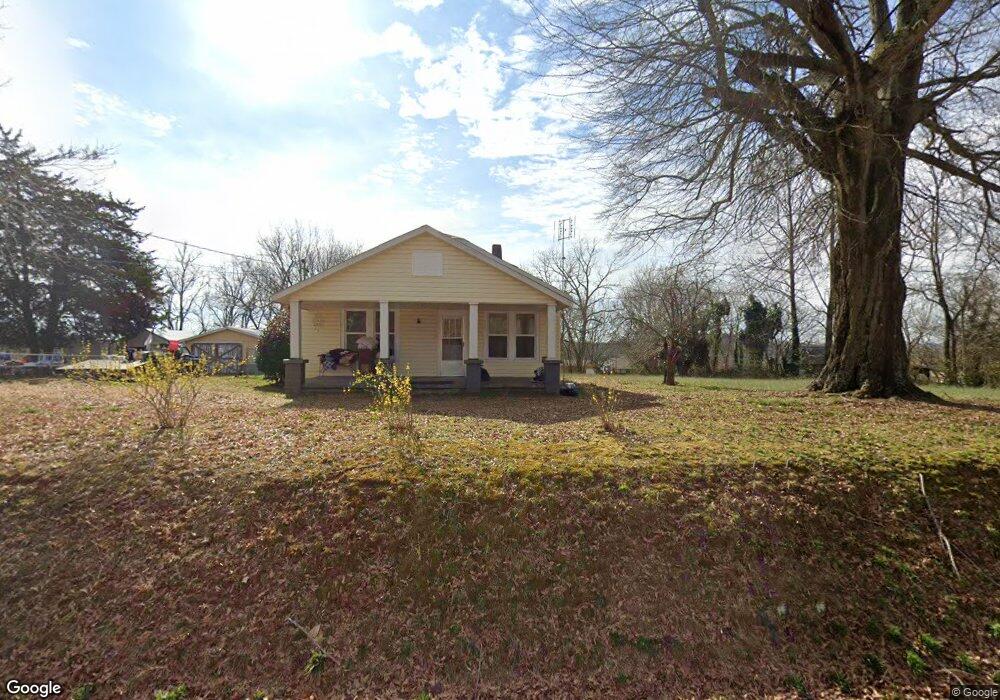
154 Midway Crossing Cornelia, GA 30531
Estimated Value: $127,000 - $193,000
2
Beds
1
Bath
924
Sq Ft
$176/Sq Ft
Est. Value
About This Home
This home is located at 154 Midway Crossing, Cornelia, GA 30531 and is currently estimated at $162,887, approximately $176 per square foot. 154 Midway Crossing is a home located in Habersham County with nearby schools including Demorest Elementary School, Wilbanks Middle School, and Habersham Success Academy.
Ownership History
Date
Name
Owned For
Owner Type
Purchase Details
Closed on
May 19, 2021
Sold by
Barron Kay H
Bought by
M Xing Llc
Current Estimated Value
Purchase Details
Closed on
Dec 31, 2019
Sold by
Herford Rentals Limited
Bought by
Barron Kay
Create a Home Valuation Report for This Property
The Home Valuation Report is an in-depth analysis detailing your home's value as well as a comparison with similar homes in the area
Home Values in the Area
Average Home Value in this Area
Purchase History
| Date | Buyer | Sale Price | Title Company |
|---|---|---|---|
| M Xing Llc | -- | -- | |
| Barron Kay | -- | -- |
Source: Public Records
Tax History
| Year | Tax Paid | Tax Assessment Tax Assessment Total Assessment is a certain percentage of the fair market value that is determined by local assessors to be the total taxable value of land and additions on the property. | Land | Improvement |
|---|---|---|---|---|
| 2025 | $1,523 | $63,048 | $19,716 | $43,332 |
| 2024 | $1,251 | $48,184 | $17,640 | $30,544 |
| 2023 | $1,076 | $43,048 | $17,640 | $25,408 |
| 2022 | $1,024 | $39,260 | $17,640 | $21,620 |
| 2021 | $960 | $36,972 | $17,640 | $19,332 |
| 2020 | $923 | $34,308 | $17,640 | $16,668 |
| 2019 | $924 | $34,308 | $17,640 | $16,668 |
| 2018 | $916 | $34,308 | $17,640 | $16,668 |
| 2017 | $0 | $32,992 | $17,640 | $15,352 |
| 2016 | $860 | $82,480 | $17,640 | $15,352 |
| 2015 | $850 | $82,480 | $17,640 | $15,352 |
| 2014 | $859 | $81,840 | $17,640 | $15,096 |
| 2013 | -- | $32,736 | $17,640 | $15,096 |
Source: Public Records
Map
Nearby Homes
- 159 Hardyville Cir
- 180 Springbrook Dr
- 161 Springbrook Dr
- 277 Stonebrook Dr
- 4444 State Highway 365
- 2778 J Warren Rd
- 226 Chestnut Ave
- 2894 Chase Rd
- 0 Furniture Dr Unit 7545752
- 0 Furniture Dr Unit 10484163
- 241 Huntington Manor Ct
- 716 Westcrest Ln
- Plan 2131 at Habersham Meadows
- Plan 1709 at Habersham Meadows
- Plan 2307 at Habersham Meadows
- Plan 1902 at Habersham Meadows
- Plan 3119 at Habersham Meadows
- Plan 2408 at Habersham Meadows
- Plan 2100 at Habersham Meadows
- Plan 2628 at Habersham Meadows
- 119 Midway Crossing
- 118 Midway Crossing
- 137 Midway Crossing
- 207 Cannon Bridge Rd
- 185 Midway Crossing
- 200 Midway Crossing
- 187 Cannon Bridge Rd
- 201 Midway Crossing
- 214 Midway Crossing
- 301 Cannon Bridge Rd
- 210 Cannon Bridge Rd
- 225 Midway Crossing
- 228 Midway Crossing
- 661 Historic Highway 441
- 661 Historic 441 Hwy
- 246 Midway Crossing
- 285 Midway Crossing
- 186 Cannon Bridge Rd
- 224 Merchants Way
- 700 Historical Highway 441