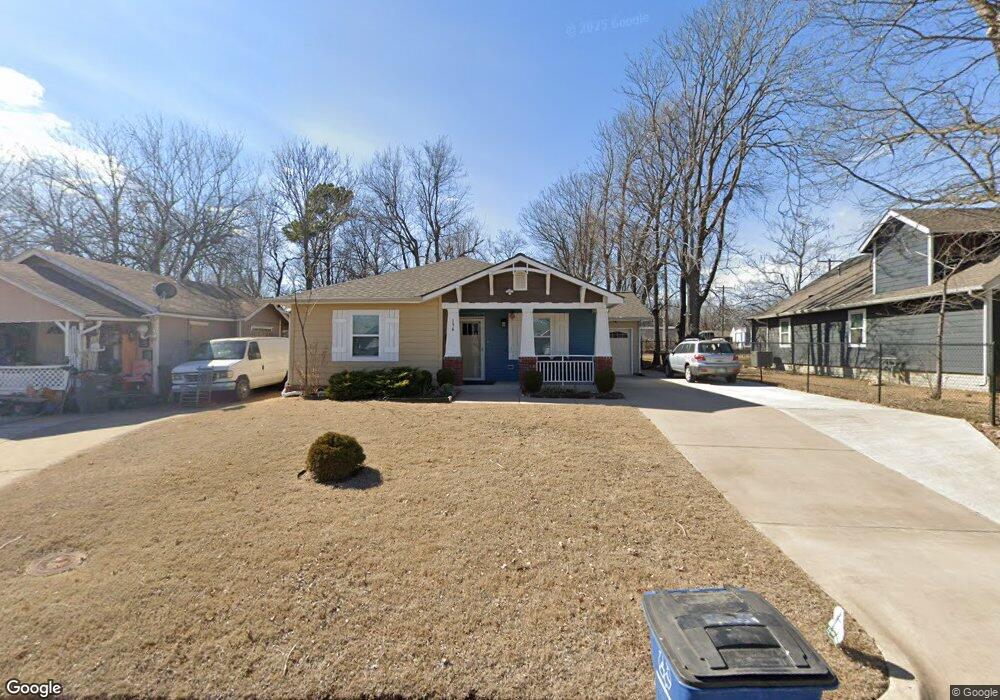
154 N Delaware Place Tulsa, OK 74110
Kendall-Whittier NeighborhoodEstimated Value: $183,000 - $225,000
--
Bed
1
Bath
1,485
Sq Ft
$133/Sq Ft
Est. Value
About This Home
This home is located at 154 N Delaware Place, Tulsa, OK 74110 and is currently estimated at $197,233, approximately $132 per square foot. 154 N Delaware Place is a home located in Tulsa County with nearby schools including Sequoyah Elementary School, Monroe Demonstration Academy, and McLain High School of Science and Technology.
Ownership History
Date
Name
Owned For
Owner Type
Purchase Details
Closed on
Aug 4, 2016
Sold by
Tulsa Habitat For Humanity Inc
Bought by
Mung Suan Lian San and Cing Zen Tawi
Current Estimated Value
Purchase Details
Closed on
Aug 6, 2011
Sold by
Mahaffy Joseph M and Seiger Leslie A
Bought by
Tulsa Habitat For Humanity Inc
Purchase Details
Closed on
Mar 7, 2007
Sold by
Harrod Jesse and Harrod Jill A
Bought by
Mahaffy Joseph M
Purchase Details
Closed on
Dec 1, 2006
Sold by
Harrod Jill
Bought by
Harrod Jesse
Purchase Details
Closed on
Nov 22, 2006
Sold by
Scott Jack
Bought by
Obrien Sandra
Purchase Details
Closed on
Oct 30, 2006
Sold by
Harrod Jesse
Bought by
Mahaffy Joseph M
Purchase Details
Closed on
Mar 28, 2006
Sold by
Obrien Sandra
Bought by
Harrod Jesse
Purchase Details
Closed on
Nov 8, 1999
Sold by
Weller Janet E
Bought by
Weller Jeffrey E
Create a Home Valuation Report for This Property
The Home Valuation Report is an in-depth analysis detailing your home's value as well as a comparison with similar homes in the area
Home Values in the Area
Average Home Value in this Area
Purchase History
| Date | Buyer | Sale Price | Title Company |
|---|---|---|---|
| Mung Suan Lian San | -- | None Available | |
| Tulsa Habitat For Humanity Inc | -- | None Available | |
| Mahaffy Joseph M | -- | None Available | |
| Mahaffy Joseph M | -- | None Available | |
| Harrod Jesse | -- | None Available | |
| Obrien Sandra | -- | None Available | |
| Mahaffy Joseph M | $40,000 | None Available | |
| Harrod Jesse | $36,000 | None Available | |
| Weller Jeffrey E | -- | -- |
Source: Public Records
Tax History Compared to Growth
Tax History
| Year | Tax Paid | Tax Assessment Tax Assessment Total Assessment is a certain percentage of the fair market value that is determined by local assessors to be the total taxable value of land and additions on the property. | Land | Improvement |
|---|---|---|---|---|
| 2024 | $1,502 | $12,222 | $526 | $11,696 |
| 2023 | $1,502 | $12,837 | $663 | $12,174 |
| 2022 | $1,528 | $11,463 | $681 | $10,782 |
| 2021 | $1,466 | $11,100 | $908 | $10,192 |
| 2020 | $1,446 | $11,100 | $908 | $10,192 |
| 2019 | $1,521 | $11,100 | $908 | $10,192 |
| 2018 | $1,524 | $11,100 | $908 | $10,192 |
| 2017 | $1,522 | $12,100 | $990 | $11,110 |
| 2016 | $591 | $4,400 | $990 | $3,410 |
| 2015 | $592 | $4,400 | $990 | $3,410 |
| 2014 | $586 | $4,400 | $990 | $3,410 |
Source: Public Records
Map
Nearby Homes
- 812 N Delaware Place
- 192 N College Ave
- 141 N College Ave
- 2812 E Admiral Ct
- 2819 E Admiral Place
- 835 N Columbia Ave
- 504 N Florence Place
- 3118 E Archer St
- 3202 E Haskell St
- 2836 E Admiral Blvd
- 2823 E 1st St
- 2913 E 1st St
- 2747 E 1st St
- 2628 E Admiral Blvd
- 2524 E Admiral Ct
- 2624 E Admiral Blvd
- 2732 E 1st St
- 56 N Atlanta Ave
- 3310 E Admiral Ct
- 2807 E 3rd St
- 150 N Delaware Place
- 158 N Delaware Place
- 146 N Delaware Place
- 155 N Delaware Ave
- 153 N Delaware Ave
- 157 N Delaware Ave
- 142 N Delaware Place
- 145 N Delaware Ave
- 153 N Delaware Place
- 2813 E Haskell St
- 2829 E Haskell St
- 149 N Delaware Place
- 157 N Delaware Place
- 138 N Delaware Place
- 147 N Delaware Place
- 2811 E Haskell St
- 141 N Delaware Ave
- 2819 E Haskell St
- 2819 E Haskell St Unit 4
- 141 N Delaware Place