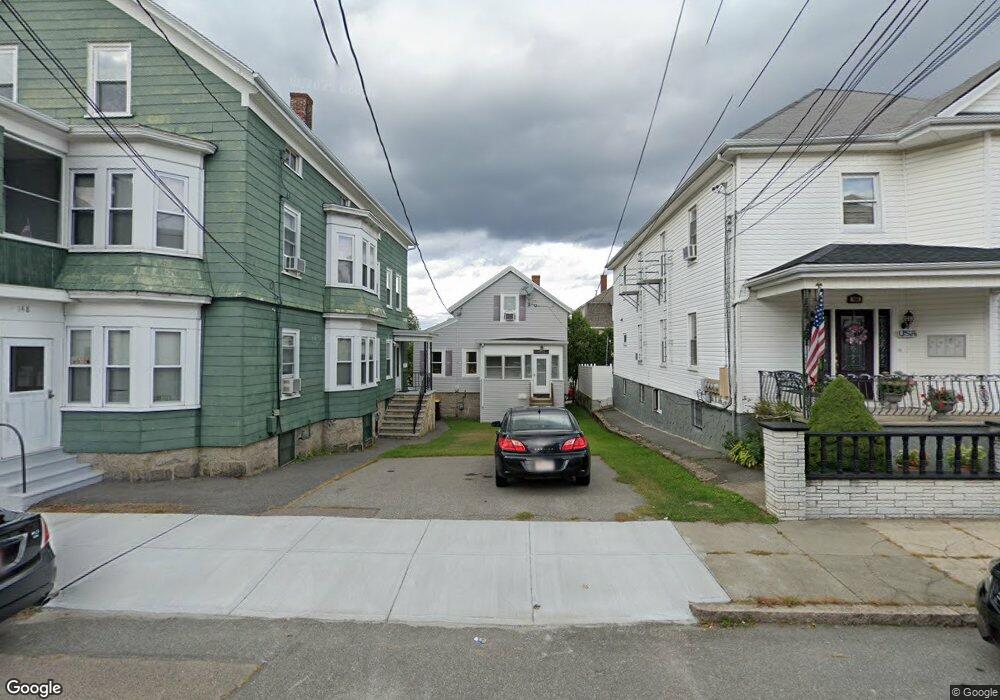
154 Oliver St Fall River, MA 02724
Father Kelly NeighborhoodEstimated Value: $335,291 - $392,000
2
Beds
1
Bath
1,092
Sq Ft
$328/Sq Ft
Est. Value
About This Home
This home is located at 154 Oliver St, Fall River, MA 02724 and is currently estimated at $358,073, approximately $327 per square foot. 154 Oliver St is a home located in Bristol County with nearby schools including Carlton M. Viveiros Elementary School, Matthew J. Kuss Middle School, and B M C Durfee High School.
Ownership History
Date
Name
Owned For
Owner Type
Purchase Details
Closed on
Nov 24, 2009
Sold by
Copley Dana T and Reagan-Copley Nancy L
Bought by
Milan Bobby
Current Estimated Value
Home Financials for this Owner
Home Financials are based on the most recent Mortgage that was taken out on this home.
Original Mortgage
$125,661
Outstanding Balance
$81,795
Interest Rate
4.86%
Mortgage Type
Purchase Money Mortgage
Estimated Equity
$276,278
Purchase Details
Closed on
Sep 5, 2006
Sold by
Cabral Kelly A
Bought by
Copley Dana T and Reagan-Copley Nancy L
Purchase Details
Closed on
Jul 9, 2004
Sold by
Reagan Juliette B
Bought by
Reagan Nancy L
Home Financials for this Owner
Home Financials are based on the most recent Mortgage that was taken out on this home.
Original Mortgage
$94,500
Interest Rate
6.32%
Mortgage Type
Purchase Money Mortgage
Create a Home Valuation Report for This Property
The Home Valuation Report is an in-depth analysis detailing your home's value as well as a comparison with similar homes in the area
Home Values in the Area
Average Home Value in this Area
Purchase History
We collect this data history from publicly available records. To have your information removed, we recommend requesting removal directly through your county’s website.
| Date | Buyer | Sale Price | Title Company |
|---|---|---|---|
| Milan Bobby | $128,000 | -- | |
| Copley Dana T | -- | -- | |
| Cabral Kelly A | -- | -- | |
| Reagan Nancy L | $160,000 | -- |
Source: Public Records
Mortgage History
We collect this data history from publicly available records. To have your information removed, we recommend requesting removal directly through your county’s website.
| Date | Status | Borrower | Loan Amount |
|---|---|---|---|
| Open | Reagan Nancy L | $10,000 | |
| Open | Milan Bobby | $125,661 | |
| Previous Owner | Reagan Nancy L | $94,500 |
Source: Public Records
Tax History
| Year | Tax Paid | Tax Assessment Tax Assessment Total Assessment is a certain percentage of the fair market value that is determined by local assessors to be the total taxable value of land and additions on the property. | Land | Improvement |
|---|---|---|---|---|
| 2025 | $3,276 | $286,100 | $105,100 | $181,000 |
| 2024 | $3,043 | $264,800 | $101,200 | $163,600 |
| 2023 | $2,924 | $238,300 | $83,700 | $154,600 |
| 2022 | $2,564 | $203,200 | $79,700 | $123,500 |
| 2021 | $2,438 | $176,300 | $75,800 | $100,500 |
| 2020 | $2,470 | $170,900 | $74,700 | $96,200 |
| 2019 | $2,372 | $162,700 | $71,900 | $90,800 |
| 2018 | $2,278 | $155,800 | $77,900 | $77,900 |
| 2017 | $2,120 | $151,400 | $74,200 | $77,200 |
| 2016 | $2,072 | $152,000 | $79,000 | $73,000 |
| 2015 | $1,988 | $152,000 | $79,000 | $73,000 |
| 2014 | $1,883 | $149,700 | $76,700 | $73,000 |
Source: Public Records
Map
Nearby Homes
- 600 Broadway
- 455 Middle St
- 15 Oliver St
- 4 Oliver St
- 391 Middle St
- 420 Bradford Ave
- 444 Center St
- 425 Division St
- 423 Division St
- 403 Division St Unit 13
- 403 Division St Unit 5
- 403 Division St Unit 11
- 403 Division St Unit 12
- 334 Fountain St
- 284 Broadway Unit 288
- 278 Division St
- 34-36 Park St
- 40 Park St
- 233 Eagle St
- 227 Eagle St
- 138 Oliver St
- 124 Oliver St
- 148 Oliver St
- 148 Oliver St Unit 2
- 545 Middle St
- 533 Middle St
- 533 Middle St Unit 3
- 139 Oliver St Unit 1
- 139 Oliver St Unit 3
- 139 Oliver St Unit 1-4
- 542 Broadway
- 542 Broadway Unit 2
- 542 Broadway Unit 3
- 528 Broadway
- 137 Oliver St Unit 2
- 137 Oliver St Unit 3
- 137 Oliver St
- 543 Middle St Unit 3
- 543 Middle St Unit 1left
- 145 Oliver St
Your Personal Tour Guide
Ask me questions while you tour the home.