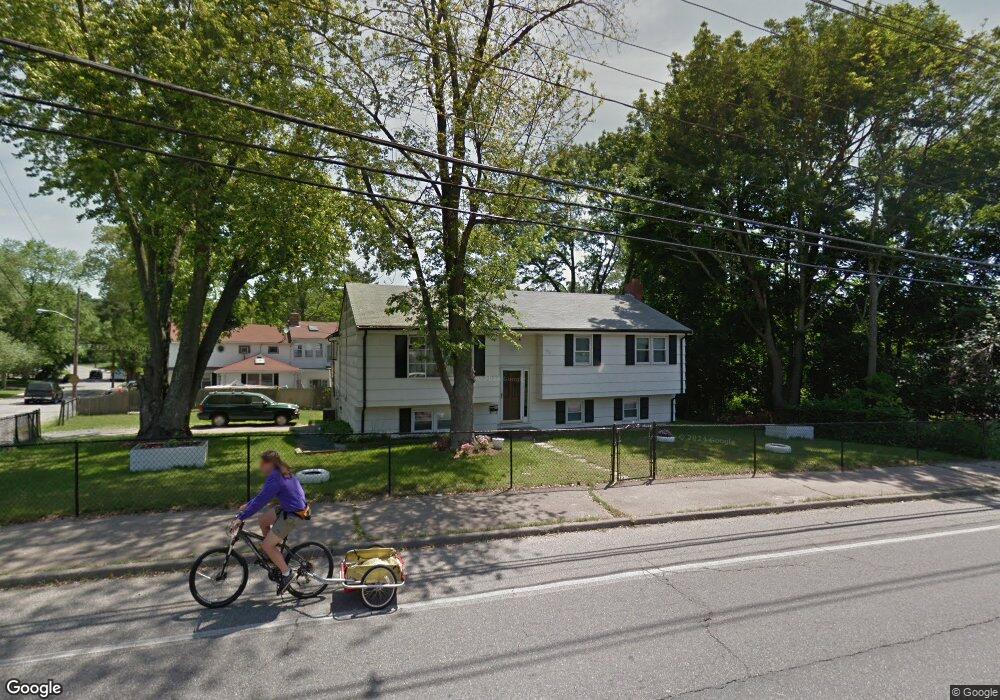
154 Quincy St Brockton, MA 02302
Estimated Value: $488,000 - $589,000
4
Beds
2
Baths
1,328
Sq Ft
$413/Sq Ft
Est. Value
About This Home
This home is located at 154 Quincy St, Brockton, MA 02302 and is currently estimated at $548,652, approximately $413 per square foot. 154 Quincy St is a home located in Plymouth County with nearby schools including Brookfield Elementary School, Mary E. Baker Elementary School, and Downey Elementary School.
Ownership History
Date
Name
Owned For
Owner Type
Purchase Details
Closed on
Jul 31, 2006
Sold by
Ducheine Gladys
Bought by
Cyrus Marvin
Current Estimated Value
Home Financials for this Owner
Home Financials are based on the most recent Mortgage that was taken out on this home.
Original Mortgage
$297,000
Outstanding Balance
$177,441
Interest Rate
6.67%
Mortgage Type
Purchase Money Mortgage
Estimated Equity
$371,211
Create a Home Valuation Report for This Property
The Home Valuation Report is an in-depth analysis detailing your home's value as well as a comparison with similar homes in the area
Home Values in the Area
Average Home Value in this Area
Purchase History
| Date | Buyer | Sale Price | Title Company |
|---|---|---|---|
| Cyrus Marvin | $297,000 | -- |
Source: Public Records
Mortgage History
| Date | Status | Borrower | Loan Amount |
|---|---|---|---|
| Open | Cyrus Marvin | $297,000 |
Source: Public Records
Tax History Compared to Growth
Tax History
| Year | Tax Paid | Tax Assessment Tax Assessment Total Assessment is a certain percentage of the fair market value that is determined by local assessors to be the total taxable value of land and additions on the property. | Land | Improvement |
|---|---|---|---|---|
| 2025 | $5,882 | $485,700 | $147,200 | $338,500 |
| 2024 | $5,503 | $457,800 | $147,200 | $310,600 |
| 2023 | $5,313 | $409,300 | $112,300 | $297,000 |
| 2022 | $5,012 | $358,800 | $102,200 | $256,600 |
| 2021 | $4,826 | $332,800 | $96,400 | $236,400 |
| 2020 | $4,493 | $296,600 | $92,300 | $204,300 |
| 2019 | $4,359 | $280,500 | $86,600 | $193,900 |
| 2018 | $4,135 | $257,500 | $86,600 | $170,900 |
| 2017 | $3,793 | $235,600 | $86,600 | $149,000 |
| 2016 | $3,791 | $218,400 | $82,700 | $135,700 |
| 2015 | $3,557 | $196,000 | $82,700 | $113,300 |
| 2014 | $3,427 | $189,000 | $82,700 | $106,300 |
Source: Public Records
Map
Nearby Homes
- 11 Pinehurst Ave
- 174 Quincy St
- 148 Quincy St
- 15 Pinehurst Ave
- 149 Quincy St
- 14 Pinehurst Ave
- 142 Quincy St
- 19 Pinehurst Ave
- 141 Quincy St
- 18 Pinehurst Ave
- 194 Quincy St
- 25 Pinehurst Ave
- 24 Pinehurst Ave
- 132 Quincy St
- 29 Pinehurst Ave
- 179 Quincy St
- 179 Quincy St Unit C
- 131 Quincy St
- 34 Pinehurst Ave
- 35 Pinehurst Ave