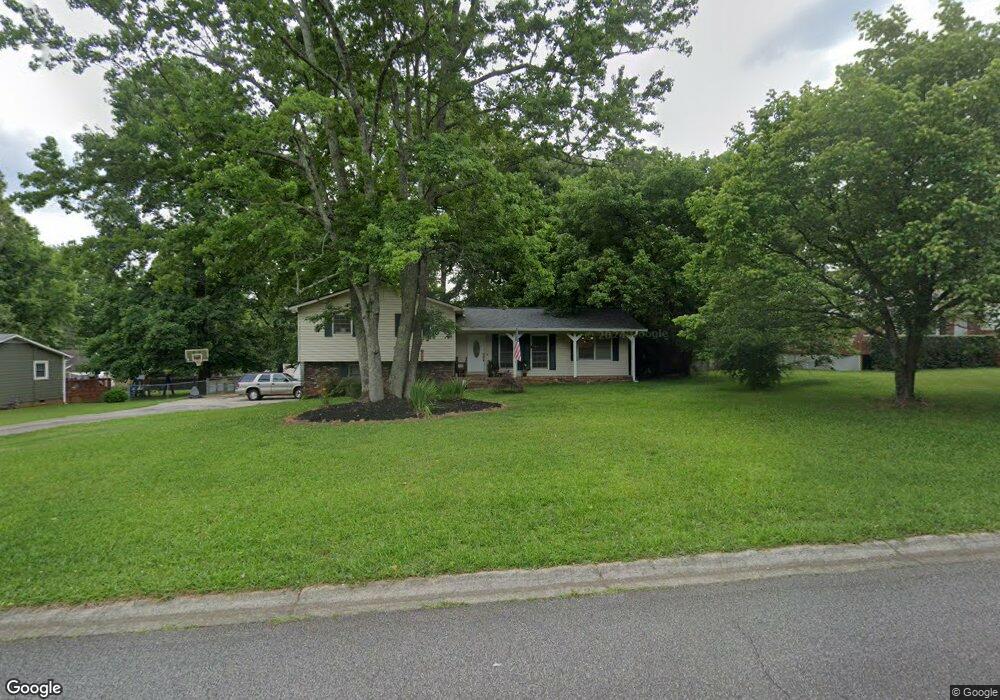
154 Sequoyah Cir Canton, GA 30115
Estimated Value: $296,000 - $341,217
3
Beds
2
Baths
1,460
Sq Ft
$218/Sq Ft
Est. Value
About This Home
This home is located at 154 Sequoyah Cir, Canton, GA 30115 and is currently estimated at $318,609, approximately $218 per square foot. 154 Sequoyah Cir is a home located in Cherokee County with nearby schools including Holly Springs Elementary School, Rusk Middle School, and Sequoyah High School.
Ownership History
Date
Name
Owned For
Owner Type
Purchase Details
Closed on
Aug 1, 2019
Sold by
Walker Brian Daniel
Bought by
Walker Brian Daniel and Mitchell-Walker April Mae
Current Estimated Value
Purchase Details
Closed on
Jun 9, 2011
Sold by
Hud & Housing Of Urban Dev
Bought by
Walker Brian
Home Financials for this Owner
Home Financials are based on the most recent Mortgage that was taken out on this home.
Original Mortgage
$78,932
Interest Rate
4.75%
Mortgage Type
FHA
Purchase Details
Closed on
Jul 6, 2010
Sold by
Bac Hm Lns Svcng Lp
Bought by
Hud-Housing Of Urban Dev
Purchase Details
Closed on
Jul 12, 2007
Sold by
Prince Donald G and Prince Sheledia D
Bought by
Jones Chuck L
Home Financials for this Owner
Home Financials are based on the most recent Mortgage that was taken out on this home.
Original Mortgage
$158,512
Interest Rate
6.71%
Mortgage Type
FHA
Create a Home Valuation Report for This Property
The Home Valuation Report is an in-depth analysis detailing your home's value as well as a comparison with similar homes in the area
Home Values in the Area
Average Home Value in this Area
Purchase History
| Date | Buyer | Sale Price | Title Company |
|---|---|---|---|
| Walker Brian Daniel | -- | -- | |
| Walker Brian | $75,700 | -- | |
| Hud-Housing Of Urban Dev | -- | -- | |
| Bac Home Loans Servicing Lp | $161,816 | -- | |
| Jones Chuck L | $161,000 | -- |
Source: Public Records
Mortgage History
| Date | Status | Borrower | Loan Amount |
|---|---|---|---|
| Previous Owner | Walker Brian | $78,932 | |
| Previous Owner | Jones Chuck L | $158,512 |
Source: Public Records
Tax History
| Year | Tax Paid | Tax Assessment Tax Assessment Total Assessment is a certain percentage of the fair market value that is determined by local assessors to be the total taxable value of land and additions on the property. | Land | Improvement |
|---|---|---|---|---|
| 2025 | $3,650 | $138,972 | $26,000 | $112,972 |
| 2024 | $3,143 | $120,932 | $22,400 | $98,532 |
| 2023 | $3,206 | $123,372 | $22,400 | $100,972 |
| 2022 | $2,734 | $104,012 | $22,400 | $81,612 |
| 2021 | $2,316 | $81,572 | $18,800 | $62,772 |
| 2020 | $2,100 | $73,892 | $16,800 | $57,092 |
| 2019 | $1,937 | $68,160 | $16,000 | $52,160 |
| 2018 | $1,857 | $64,960 | $14,000 | $50,960 |
| 2017 | $1,555 | $134,900 | $12,400 | $41,560 |
| 2016 | $1,238 | $106,300 | $9,800 | $32,720 |
| 2015 | $1,224 | $104,100 | $8,400 | $33,240 |
| 2014 | $1,240 | $105,200 | $8,400 | $33,680 |
Source: Public Records
Map
Nearby Homes
- 1100 Spring Place
- 454 Sugarberry Ln
- 190 Redbud Rd
- 330 Sassafras Way
- 302 Hickory Ln
- 175 Redbud Rd
- 179 Redbud Rd
- 183 Redbud Rd
- 187 Redbud Rd
- 191 Redbud Rd
- 195 Redbud Rd
- 108 Riley Way
- 221 Mackenzie Ct
- 704 Jay St
- 802 Hampton Way
- 386 Mason Dr
- 1980 Morgan Trace
- 132 Carl Barrett Dr
- 153 Spring Creek Ct Unit 1
- 590 Arthur Rd
- 152 Sequoyah Cir
- 156 Sequoyah Cir
- 116 Sequoyah Cir
- 118 Sequoyah Cir
- 165 Sequoyah Cir
- 150 Sequoyah Cir
- 158 Sequoyah Cir
- 114 Sequoyah Cir
- 155 Sequoyah Cir Unit 28
- 155 Sequoyah Cir
- 153 Sequoyah Cir
- 120 Sequoyah Cir
- 151 Sequoyah Cir
- 112 Sequoyah Cir
- 160 Sequoyah Cir
- 122 Sequoyah Cir
- 149 Sequoyah Cir
- 117 Sequoyah Cir
- 115 Sequoyah Cir
- 170 Messer Reece Dr
Your Personal Tour Guide
Ask me questions while you tour the home.