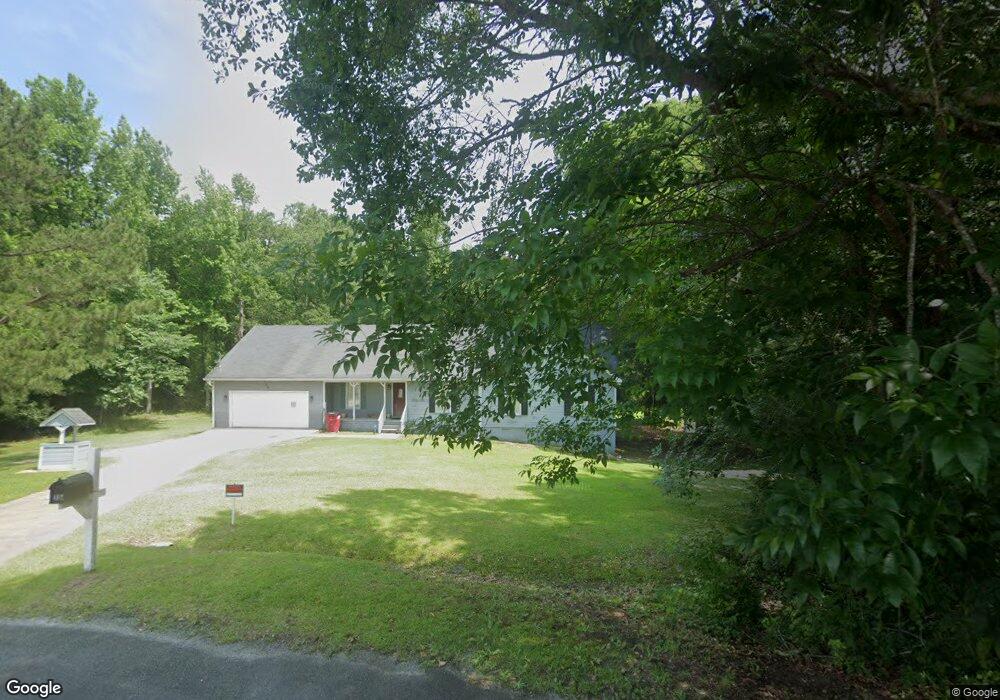
154 Southfork Dr Unit 35 Macon, GA 31220
Estimated Value: $276,000 - $291,000
4
Beds
2
Baths
1,868
Sq Ft
$152/Sq Ft
Est. Value
About This Home
This home is located at 154 Southfork Dr Unit 35, Macon, GA 31220 and is currently estimated at $283,329, approximately $151 per square foot. 154 Southfork Dr Unit 35 is a home located in Bibb County with nearby schools including Heritage Elementary School, Weaver Middle School, and Westside High School.
Ownership History
Date
Name
Owned For
Owner Type
Purchase Details
Closed on
Sep 13, 2013
Sold by
Wrs Homes Llc
Bought by
Hawkins Dewitt A
Current Estimated Value
Home Financials for this Owner
Home Financials are based on the most recent Mortgage that was taken out on this home.
Original Mortgage
$116,451
Outstanding Balance
$86,600
Interest Rate
4.39%
Mortgage Type
VA
Estimated Equity
$196,729
Purchase Details
Closed on
Dec 21, 2012
Sold by
Wrs Homes Llc
Bought by
Equity Trus Co and Mychelle O Shackelford Ira
Purchase Details
Closed on
Oct 2, 2012
Sold by
Citimortgage Inc
Bought by
Federal National Mortgage Association
Purchase Details
Closed on
May 5, 2006
Sold by
Brown Carolyn L
Bought by
Brown Carolyn L and Brown Rickey D
Home Financials for this Owner
Home Financials are based on the most recent Mortgage that was taken out on this home.
Original Mortgage
$115,500
Interest Rate
6.15%
Mortgage Type
New Conventional
Create a Home Valuation Report for This Property
The Home Valuation Report is an in-depth analysis detailing your home's value as well as a comparison with similar homes in the area
Home Values in the Area
Average Home Value in this Area
Purchase History
| Date | Buyer | Sale Price | Title Company |
|---|---|---|---|
| Hawkins Dewitt A | $114,000 | None Available | |
| Equity Trus Co | $45,000 | None Available | |
| Wrs Homes Llc | $46,600 | -- | |
| Federal National Mortgage Association | $121,797 | None Available | |
| Citimortgage Inc | $121,800 | -- | |
| Brown Carolyn L | -- | Lsi |
Source: Public Records
Mortgage History
| Date | Status | Borrower | Loan Amount |
|---|---|---|---|
| Open | Hawkins Dewitt A | $116,451 | |
| Previous Owner | Brown Carolyn L | $115,500 |
Source: Public Records
Tax History Compared to Growth
Tax History
| Year | Tax Paid | Tax Assessment Tax Assessment Total Assessment is a certain percentage of the fair market value that is determined by local assessors to be the total taxable value of land and additions on the property. | Land | Improvement |
|---|---|---|---|---|
| 2025 | $2,103 | $100,144 | $21,672 | $78,472 |
| 2024 | $2,129 | $98,314 | $21,672 | $76,642 |
| 2023 | $1,285 | $83,064 | $21,672 | $61,392 |
| 2022 | $1,994 | $71,486 | $16,667 | $54,819 |
| 2021 | $1,480 | $52,805 | $16,667 | $36,138 |
| 2020 | $1,512 | $52,805 | $16,667 | $36,138 |
| 2019 | $1,214 | $52,805 | $16,667 | $36,138 |
| 2018 | $2,512 | $52,805 | $16,667 | $36,138 |
| 2017 | $1,126 | $52,043 | $16,667 | $35,376 |
| 2016 | $1,300 | $52,043 | $16,667 | $35,376 |
| 2015 | $1,845 | $52,043 | $16,667 | $35,376 |
| 2014 | $1,530 | $62,544 | $16,667 | $45,878 |
Source: Public Records
Map
Nearby Homes
- 515 Candlewick Ct
- 508 Candlewick Ct
- 103 Dorchester Ct
- 1751 Bridle Ln
- 7359 Thomaston Rd
- 1698 Greentree Pkwy
- 153 Montrose Dr
- 1776 Bridle
- 933 Chisholm Trail
- 637 Will Scarlet Way
- 711 Latrobe Way
- 427 Table Mountain Dr
- 731 Latrobe Way
- 727 Latrobe Way
- 327 Ivystone Dr
- 941 Galahad Cir
- 1371 Greentree Pkwy
- 1376 Greentree Pkwy Unit II
- 678 Will Scarlet Way
- 1345 Greentree Pkwy
- 154 Southfork Dr
- 153 Southfork Dr
- 155 Southfork Dr
- 152 Southfork Dr
- 151 Southfork Dr
- 150 Southfork Dr
- 144 Kimmeridge Dr
- 149 Southfork Dr
- 148 Southfork Dr
- 147 Kimmeridge Dr
- 140 Kimmeridge Dr
- 146 Southfork Dr
- 147 Southfork Dr
- 509 Candlewick Ct
- 509 Candlewick Ct Unit 105
- 512 Candlewick Ct
- 125 Knots Landing
- 143 Kimmeridge Dr Unit /222
- 143 Kimmeridge Dr
- 123 Knots Landing