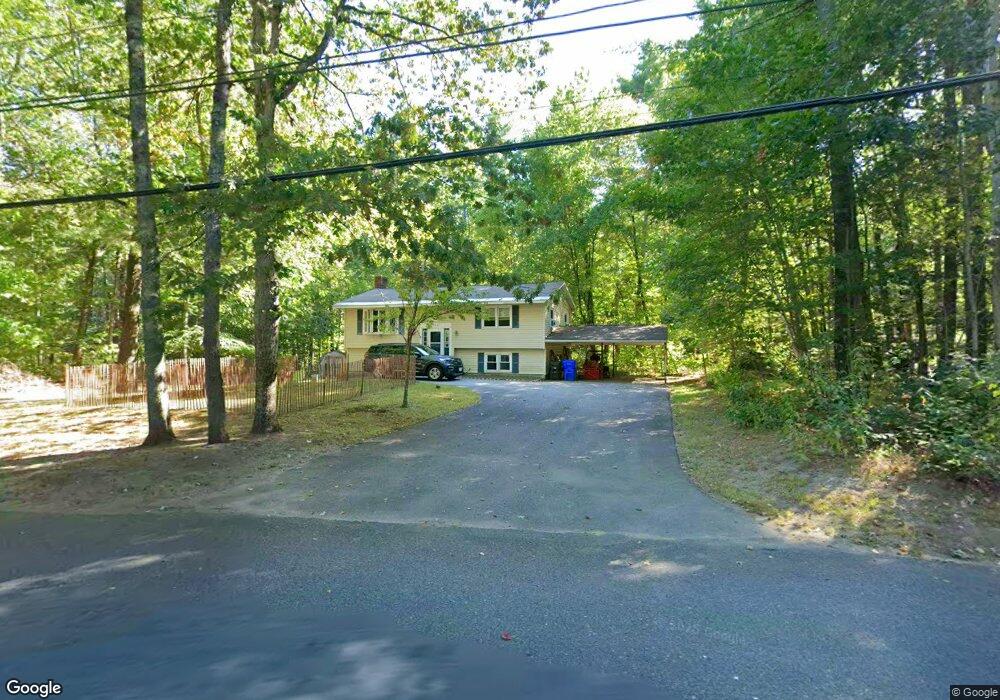
154 Squannacook Rd Shirley, MA 01464
Estimated Value: $452,689 - $567,000
3
Beds
1
Bath
1,432
Sq Ft
$347/Sq Ft
Est. Value
About This Home
This home is located at 154 Squannacook Rd, Shirley, MA 01464 and is currently estimated at $496,672, approximately $346 per square foot. 154 Squannacook Rd is a home located in Middlesex County with nearby schools including Page Hilltop School, Lura A. White Elementary School, and Ayer Shirley Regional Middle School.
Ownership History
Date
Name
Owned For
Owner Type
Purchase Details
Closed on
Jun 16, 2005
Sold by
Stark Erin M and Stark Joshua E
Bought by
Schubert Scott M
Current Estimated Value
Home Financials for this Owner
Home Financials are based on the most recent Mortgage that was taken out on this home.
Original Mortgage
$232,000
Outstanding Balance
$121,274
Interest Rate
5.78%
Mortgage Type
Purchase Money Mortgage
Estimated Equity
$375,398
Purchase Details
Closed on
Jun 1, 2001
Sold by
Goble Theron D and Goble Suk Yi
Bought by
Stark Joshua E and Stark Erin M
Home Financials for this Owner
Home Financials are based on the most recent Mortgage that was taken out on this home.
Original Mortgage
$198,432
Interest Rate
7.09%
Mortgage Type
Purchase Money Mortgage
Create a Home Valuation Report for This Property
The Home Valuation Report is an in-depth analysis detailing your home's value as well as a comparison with similar homes in the area
Home Values in the Area
Average Home Value in this Area
Purchase History
| Date | Buyer | Sale Price | Title Company |
|---|---|---|---|
| Schubert Scott M | $290,000 | -- | |
| Stark Joshua E | $200,000 | -- |
Source: Public Records
Mortgage History
| Date | Status | Borrower | Loan Amount |
|---|---|---|---|
| Open | Schubert Scott M | $232,000 | |
| Previous Owner | Stark Joshua E | $198,432 |
Source: Public Records
Tax History Compared to Growth
Tax History
| Year | Tax Paid | Tax Assessment Tax Assessment Total Assessment is a certain percentage of the fair market value that is determined by local assessors to be the total taxable value of land and additions on the property. | Land | Improvement |
|---|---|---|---|---|
| 2025 | $47 | $362,500 | $136,700 | $225,800 |
| 2024 | $4,417 | $325,500 | $125,000 | $200,500 |
| 2023 | $4,065 | $286,700 | $125,000 | $161,700 |
| 2022 | $4,283 | $276,700 | $121,100 | $155,600 |
| 2021 | $4,404 | $266,400 | $109,400 | $157,000 |
| 2020 | $4,224 | $262,200 | $109,400 | $152,800 |
| 2019 | $4,149 | $258,000 | $109,400 | $148,600 |
| 2018 | $3,924 | $239,000 | $104,700 | $134,300 |
| 2017 | $3,823 | $231,400 | $101,500 | $129,900 |
| 2016 | $3,905 | $236,500 | $101,500 | $135,000 |
| 2015 | $3,616 | $208,900 | $100,000 | $108,900 |
Source: Public Records
Map
Nearby Homes
- 111 Squannacook Rd
- 346 Townsend Rd
- 354 Townsend Rd
- 59 Squannacook Rd
- Lot 10 Christian Cir
- 37 Pepperell Rd
- 22 Townsend Rd
- 7a Lilac Cir Unit B
- 55 W Main St
- 49 Magnolia Ln Unit 49
- 21 Magnolia Ln
- 43 Longley Rd
- 65 W Main St
- 18 Crosswinds Dr
- 1790 Massachusetts Ave Unit 25
- 1790 Mass Ave Unit 3
- 1790 Massachusetts Ave Unit 22
- 166 Elmwood Rd
- 22 Lakin St
- 49 Parker Rd
- 125 Townsend Rd
- 150 Squannacook Rd
- 167 Squannacook Rd
- 121 Townsend Rd
- 2 Hunters Ln
- 146 Squannacook Rd
- 124 Townsend Rd
- 119 Townsend Rd
- 1 Hunters Ln
- 144 Squannacook Rd
- 131 Townsend Rd
- 122 Townsend Rd
- 142 Squannacook Rd
- 4 Hunters Ln
- 117 Townsend Rd
- 141 Squannacook Rd
- 3 Hunters Ln
- 135 Townsend Rd
- 140 Squannacook Rd
- 118 Townsend Rd