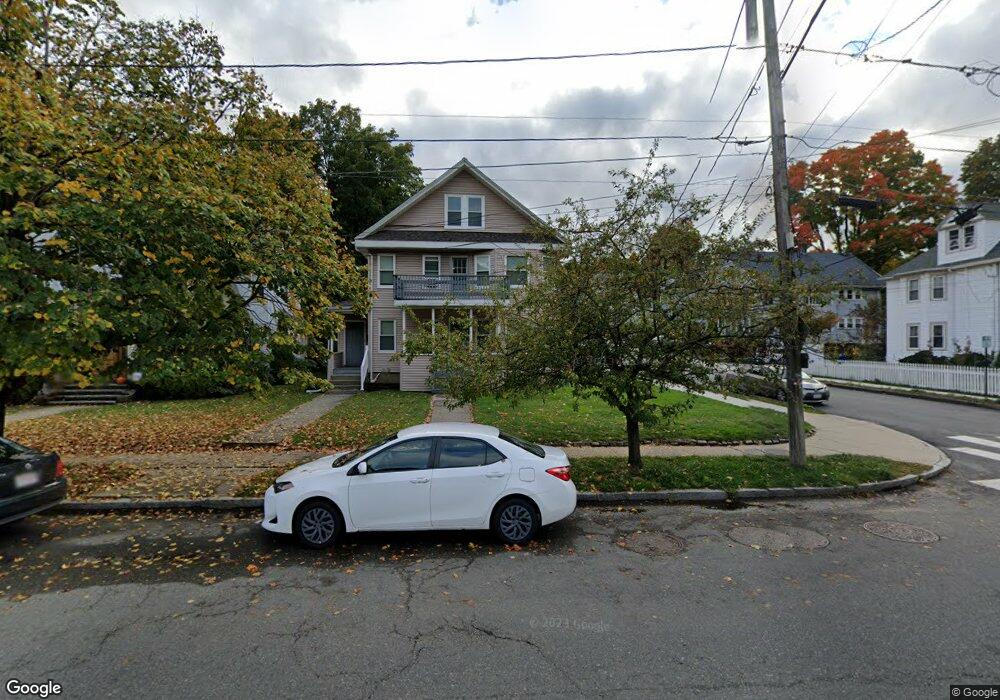
154 Tremont St Unit 2 Newton, MA 02458
Brighton NeighborhoodEstimated Value: $1,344,000 - $1,552,650
4
Beds
2
Baths
9,999
Sq Ft
$148/Sq Ft
Est. Value
About This Home
This home is located at 154 Tremont St Unit 2, Newton, MA 02458 and is currently estimated at $1,475,163, approximately $147 per square foot. 154 Tremont St Unit 2 is a home located in Middlesex County with nearby schools including Underwood Elementary School, Bigelow Middle School, and Newton North High School.
Ownership History
Date
Name
Owned For
Owner Type
Purchase Details
Closed on
Jun 11, 2014
Sold by
Kachudurian K
Bought by
Obyrne Vincent A and Obyrne Catherine N
Current Estimated Value
Home Financials for this Owner
Home Financials are based on the most recent Mortgage that was taken out on this home.
Original Mortgage
$533,850
Outstanding Balance
$407,125
Interest Rate
4.27%
Mortgage Type
Purchase Money Mortgage
Estimated Equity
$1,068,038
Create a Home Valuation Report for This Property
The Home Valuation Report is an in-depth analysis detailing your home's value as well as a comparison with similar homes in the area
Home Values in the Area
Average Home Value in this Area
Purchase History
| Date | Buyer | Sale Price | Title Company |
|---|---|---|---|
| Obyrne Vincent A | $815,000 | -- |
Source: Public Records
Mortgage History
| Date | Status | Borrower | Loan Amount |
|---|---|---|---|
| Open | Obyrne Vincent A | $533,850 |
Source: Public Records
Tax History Compared to Growth
Tax History
| Year | Tax Paid | Tax Assessment Tax Assessment Total Assessment is a certain percentage of the fair market value that is determined by local assessors to be the total taxable value of land and additions on the property. | Land | Improvement |
|---|---|---|---|---|
| 2025 | $12,330 | $1,258,200 | $789,300 | $468,900 |
| 2024 | $11,923 | $1,221,600 | $766,300 | $455,300 |
| 2023 | $11,481 | $1,127,800 | $614,600 | $513,200 |
| 2022 | $10,986 | $1,044,300 | $569,100 | $475,200 |
| 2021 | $10,309 | $958,100 | $522,100 | $436,000 |
| 2020 | $10,003 | $958,100 | $522,100 | $436,000 |
| 2019 | $9,357 | $895,400 | $487,900 | $407,500 |
| 2018 | $9,203 | $850,600 | $458,900 | $391,700 |
| 2017 | $8,678 | $780,400 | $421,000 | $359,400 |
| 2016 | $8,148 | $716,000 | $386,200 | $329,800 |
| 2015 | $7,769 | $669,200 | $360,900 | $308,300 |
Source: Public Records
Map
Nearby Homes
- 121 Tremont St Unit B1
- 99 Tremont St Unit 105
- 99 Tremont St Unit 413
- 70 Washington St Unit 70
- 70 Washington St
- 8 Tremont Place
- 106 Farlow Rd
- 21 Glenley Terrace
- 39 Champney St
- 69 Presentation Rd
- 427-435 Faneuil St Unit R4
- 206 Franklin St
- 18 Breck Ave Unit 18
- 180 Hunnewell Ave Unit 180
- 159 Washington St Unit 4
- 68 Vernon St
- 65-67 Saint James Cir
- 4 Remick Terrace
- 4 Remick Terrace Unit 4
- 32-34 Larch St
- 154 Tremont St Unit 156
- 154 Tremont St
- 00 Playstead Rd Unit 2
- 150 Tremont St
- 12 Ricker Rd
- 10 Ricker Rd
- 166 Tremont St
- 166 Tremont St Unit 1
- 166 Tremont St Unit 166
- 148 Tremont St
- 16 Ricker Rd
- 16 Ricker Rd Unit 1
- 16 Ricker Rd Unit 2
- 9 Ricker Rd Unit 11
- Lot 20 Tremont St
- 121 Tremont St
- 168 Tremont St
- 151 Tremont St
- 151 Tremont St Unit 1
- 151 Tremont St