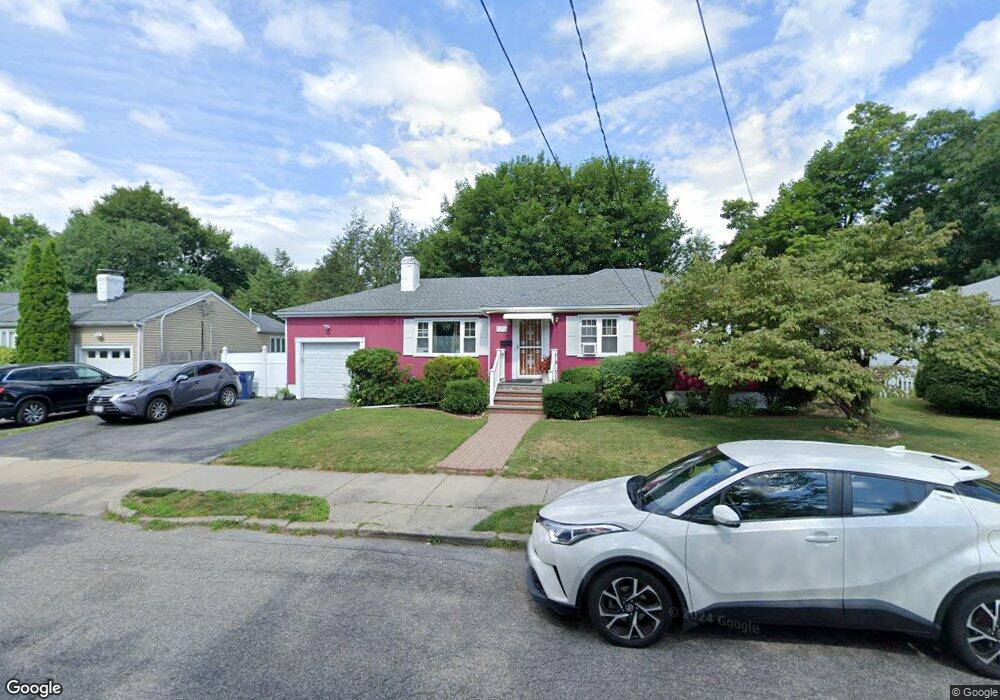
154 Truman Rd Newton Center, MA 02459
Newton Highlands NeighborhoodEstimated Value: $1,079,163 - $1,262,000
3
Beds
2
Baths
1,304
Sq Ft
$878/Sq Ft
Est. Value
About This Home
This home is located at 154 Truman Rd, Newton Center, MA 02459 and is currently estimated at $1,145,291, approximately $878 per square foot. 154 Truman Rd is a home located in Middlesex County with nearby schools including Countryside Elementary School, Charles E Brown Middle School, and Newton South High School.
Ownership History
Date
Name
Owned For
Owner Type
Purchase Details
Closed on
Dec 27, 2004
Sold by
Moy Howard and Moy Mei Kuen
Bought by
Moy Mei Kuen
Current Estimated Value
Home Financials for this Owner
Home Financials are based on the most recent Mortgage that was taken out on this home.
Original Mortgage
$300,000
Outstanding Balance
$151,365
Interest Rate
5.74%
Mortgage Type
Purchase Money Mortgage
Estimated Equity
$993,926
Create a Home Valuation Report for This Property
The Home Valuation Report is an in-depth analysis detailing your home's value as well as a comparison with similar homes in the area
Home Values in the Area
Average Home Value in this Area
Purchase History
| Date | Buyer | Sale Price | Title Company |
|---|---|---|---|
| Moy Mei Kuen | -- | -- |
Source: Public Records
Mortgage History
| Date | Status | Borrower | Loan Amount |
|---|---|---|---|
| Open | Moy Mei Kuen | $300,000 |
Source: Public Records
Tax History Compared to Growth
Tax History
| Year | Tax Paid | Tax Assessment Tax Assessment Total Assessment is a certain percentage of the fair market value that is determined by local assessors to be the total taxable value of land and additions on the property. | Land | Improvement |
|---|---|---|---|---|
| 2025 | $7,884 | $804,500 | $0 | $0 |
| 2024 | $7,624 | $0 | $0 | $0 |
| 2023 | $7,192 | $706,500 | $662,400 | $44,100 |
| 2022 | $6,882 | $654,200 | $613,300 | $40,900 |
| 2021 | $6,641 | $617,200 | $578,600 | $38,600 |
| 2020 | $6,444 | $617,200 | $578,600 | $38,600 |
| 2019 | $6,262 | $599,200 | $561,700 | $37,500 |
| 2018 | $5,929 | $548,000 | $509,900 | $38,100 |
| 2017 | $5,749 | $517,000 | $481,000 | $36,000 |
| 2016 | $5,499 | $483,200 | $449,500 | $33,700 |
| 2015 | $5,243 | $451,600 | $420,100 | $31,500 |
Source: Public Records
Map
Nearby Homes
- 250 Woodcliff Rd
- 19 Selwyn Rd
- 36 Cannon St
- 45 Brandeis Rd
- 35 Haynes Rd
- 21 Philbrick Rd
- 628 Boylston St
- 125 Oakdale Rd
- 15 Buff Cir
- 1308 Walnut St
- 671 Boylston St
- 625 Boylston St
- 1292 Walnut St
- 415 Dedham St Unit D
- 42 Sunhill Ln
- 58 Country Club Rd
- 116 Upland Ave
- 65 Levbert Rd
- 5 Halcyon Rd
- 85 Dudley Rd