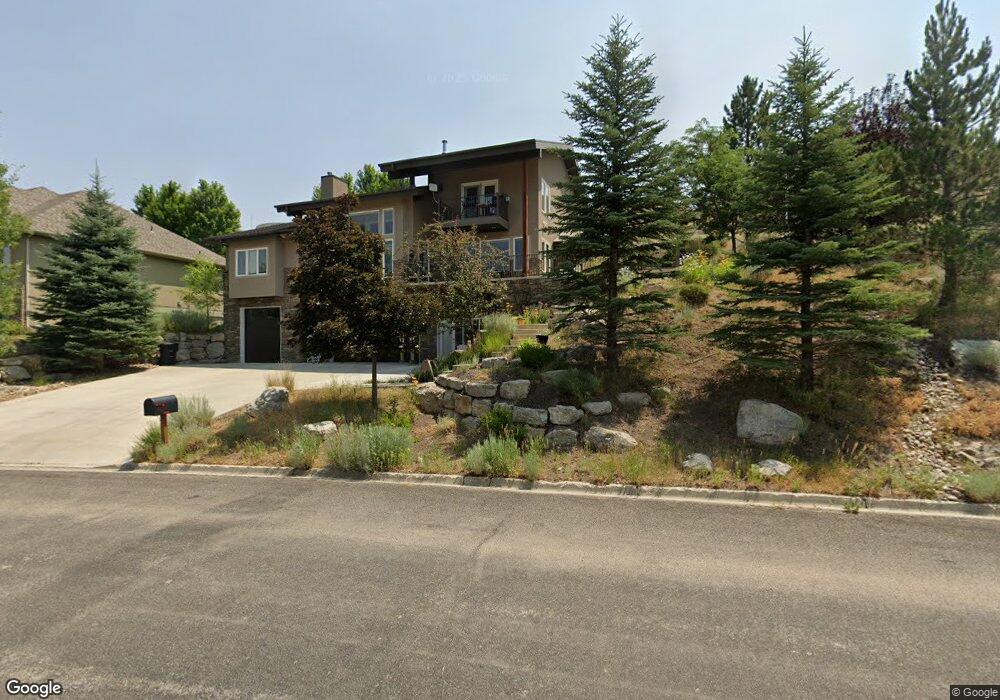
1540 Callaway Dr Heber City, UT 84032
Estimated Value: $1,035,959 - $1,320,000
--
Bed
--
Bath
2,760
Sq Ft
$425/Sq Ft
Est. Value
About This Home
This home is located at 1540 Callaway Dr, Heber City, UT 84032 and is currently estimated at $1,171,990, approximately $424 per square foot. 1540 Callaway Dr is a home located in Wasatch County with nearby schools including J.R. Smith Elementary School, Rocky Mountain Middle School, and Wasatch High School.
Ownership History
Date
Name
Owned For
Owner Type
Purchase Details
Closed on
Aug 5, 2014
Sold by
Duran James and Duran James S
Bought by
Farra John R and Miner Marra Tess A
Current Estimated Value
Home Financials for this Owner
Home Financials are based on the most recent Mortgage that was taken out on this home.
Original Mortgage
$405,000
Outstanding Balance
$308,927
Interest Rate
4.12%
Mortgage Type
New Conventional
Estimated Equity
$863,063
Purchase Details
Closed on
Apr 21, 2006
Sold by
Palenske Bruce O
Bought by
Norman Stephen K and Norman Suzanna E
Home Financials for this Owner
Home Financials are based on the most recent Mortgage that was taken out on this home.
Original Mortgage
$127,920
Interest Rate
6.29%
Mortgage Type
Purchase Money Mortgage
Purchase Details
Closed on
Aug 2, 2005
Sold by
Varvel Eric M and Varvel Shauna
Bought by
Palenske Bruce O
Create a Home Valuation Report for This Property
The Home Valuation Report is an in-depth analysis detailing your home's value as well as a comparison with similar homes in the area
Home Values in the Area
Average Home Value in this Area
Purchase History
| Date | Buyer | Sale Price | Title Company |
|---|---|---|---|
| Farra John R | -- | First American Title Co Llc | |
| Norman Stephen K | -- | Surety Title | |
| Palenske Bruce O | -- | First American Title Heber |
Source: Public Records
Mortgage History
| Date | Status | Borrower | Loan Amount |
|---|---|---|---|
| Open | Farra John R | $405,000 | |
| Previous Owner | Norman Stephen K | $127,920 |
Source: Public Records
Tax History Compared to Growth
Tax History
| Year | Tax Paid | Tax Assessment Tax Assessment Total Assessment is a certain percentage of the fair market value that is determined by local assessors to be the total taxable value of land and additions on the property. | Land | Improvement |
|---|---|---|---|---|
| 2025 | $4,733 | $930,150 | $280,000 | $650,150 |
| 2024 | $4,733 | $930,150 | $280,000 | $650,150 |
| 2023 | $4,733 | $1,053,000 | $280,000 | $773,000 |
| 2022 | $4,883 | $877,500 | $180,000 | $697,500 |
| 2021 | $3,737 | $533,519 | $100,000 | $433,519 |
| 2020 | $3,838 | $533,519 | $100,000 | $433,519 |
| 2019 | $3,636 | $293,435 | $0 | $0 |
| 2018 | $3,636 | $293,435 | $0 | $0 |
| 2017 | $2,690 | $215,919 | $0 | $0 |
| 2016 | $2,763 | $215,919 | $0 | $0 |
| 2015 | $2,635 | $215,919 | $0 | $0 |
| 2014 | $2,489 | $215,919 | $0 | $0 |
Source: Public Records
Map
Nearby Homes
- 1896 N Valley Hills Blvd
- 1741 Cove Spring Way E
- 1768 N 180 E
- 1908 N Callaway Dr
- 11252 N Regal Ridge Ct Unit 14
- 11449 Regal Ridge Ct
- 11449 Regal Ridge Ct Unit 4
- 1343 E Coyote View Cir Unit 239
- 1343 E Coyote View Cir
- 1765 N 180 E
- 1791 N 180 E
- 1910 N Cove Springs Way
- 1822 N 180 E
- 1235 N Valley Hills Blvd
- 690 Ridge Dr
- 1779 N Callaway Dr Unit 18
- 877 E Cottonwood Dr Unit 56
- 1995 N Callaway Dr
- Stockholm Plan at Coyote Ridge - Cottages
- Sundborn Plan at Coyote Ridge - Townhomes
- 1540 N Callaway Dr
- 1562 N Callaway Dr
- 1537 N Callaway Dr Unit 9
- 1512 N Callaway Dr Unit 26
- 1512 N Callaway Dr
- 1537 N Callaway Dr
- 1519 Lakeview Dr
- 1559 N Callaway Dr
- 1559 N Callaway Dr Unit 10
- 1598 Callaway Dr
- 1525 N Callaway Dr Unit 8
- 1525 N Callaway Dr
- 1525 N Callaway Dr Unit 8
- 740 Valley Hills Blvd
- 1414 Valley Hills Blvd
- 1224 Valley Hills Blvd
- 0 Valley Hills Blvd Unit 9947149
- 0 Valley Hills Blvd Unit 34
- 1840 Valley Hills Blvd Unit 41
- 1595 N Callaway Dr