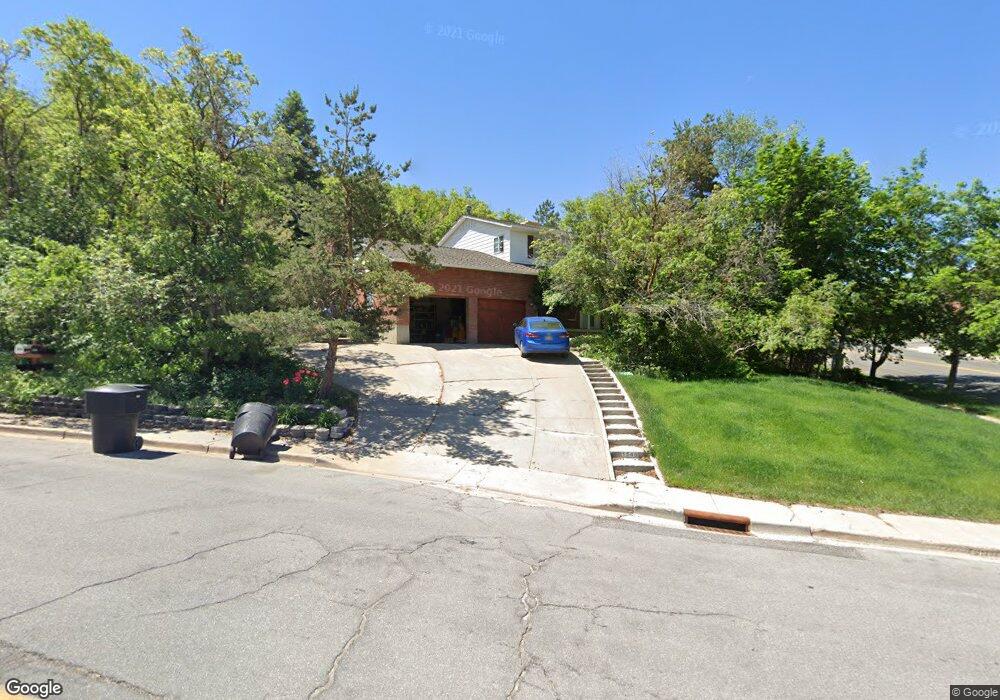
1540 Cave Hollow Way Bountiful, UT 84010
Estimated Value: $706,000 - $809,000
5
Beds
4
Baths
3,859
Sq Ft
$197/Sq Ft
Est. Value
About This Home
This home is located at 1540 Cave Hollow Way, Bountiful, UT 84010 and is currently estimated at $760,845, approximately $197 per square foot. 1540 Cave Hollow Way is a home located in Davis County with nearby schools including Valley View School, Mueller Park Junior High School, and Bountiful High School.
Ownership History
Date
Name
Owned For
Owner Type
Purchase Details
Closed on
Jun 24, 2011
Sold by
Kim Pyong
Bought by
Kim Pyong
Current Estimated Value
Home Financials for this Owner
Home Financials are based on the most recent Mortgage that was taken out on this home.
Original Mortgage
$229,000
Outstanding Balance
$157,274
Interest Rate
4.55%
Mortgage Type
New Conventional
Estimated Equity
$603,571
Purchase Details
Closed on
May 26, 2005
Sold by
Parkei Steven L and Parker Mary Jo
Bought by
Kim Pyong
Purchase Details
Closed on
Jul 18, 1997
Sold by
Gessel Wayne B and Gessel Bonnie Jo
Bought by
Parker Steven L and Parker Mary Jo
Home Financials for this Owner
Home Financials are based on the most recent Mortgage that was taken out on this home.
Original Mortgage
$184,000
Interest Rate
7.7%
Create a Home Valuation Report for This Property
The Home Valuation Report is an in-depth analysis detailing your home's value as well as a comparison with similar homes in the area
Home Values in the Area
Average Home Value in this Area
Purchase History
| Date | Buyer | Sale Price | Title Company |
|---|---|---|---|
| Kim Pyong | -- | Pinnacle Title Ins Ag | |
| Kim Pyong | -- | Bonneville Title Company | |
| Parker Steven L | -- | Associated Title Company |
Source: Public Records
Mortgage History
| Date | Status | Borrower | Loan Amount |
|---|---|---|---|
| Open | Kim Pyong | $229,000 | |
| Previous Owner | Parker Steven L | $184,000 |
Source: Public Records
Tax History Compared to Growth
Tax History
| Year | Tax Paid | Tax Assessment Tax Assessment Total Assessment is a certain percentage of the fair market value that is determined by local assessors to be the total taxable value of land and additions on the property. | Land | Improvement |
|---|---|---|---|---|
| 2025 | $3,596 | $358,050 | $156,126 | $201,924 |
| 2024 | $3,386 | $342,650 | $197,975 | $144,675 |
| 2023 | $3,436 | $629,000 | $232,711 | $396,289 |
| 2022 | $3,538 | $354,750 | $124,922 | $229,828 |
| 2021 | $3,429 | $492,000 | $183,238 | $308,762 |
| 2020 | $2,713 | $422,000 | $170,332 | $251,668 |
| 2019 | $2,824 | $416,000 | $176,530 | $239,470 |
| 2018 | $2,596 | $390,000 | $178,075 | $211,925 |
| 2016 | $2,499 | $199,045 | $53,536 | $145,509 |
| 2015 | $2,389 | $184,030 | $53,536 | $130,494 |
| 2014 | $2,482 | $195,631 | $53,536 | $142,095 |
| 2013 | -- | $142,655 | $78,402 | $64,253 |
Source: Public Records
Map
Nearby Homes
- 1820 S High Pointe Dr
- 1483 Maple Hills Dr
- 1960 S High Pointe Dr Unit 22
- 2063 Ridgehollow Dr
- 1785 1450 E Unit 604
- 1735 S Temple Ct Unit 203
- 1596 E Millbrook Way
- 2845 Wood Hollow Way
- 1399 E Millbrook Way
- 2321 S 900 E
- 831 E San Simeon Way S
- 771 E 1825 S
- 1761 S Davis Blvd
- 630 E 1800 S
- 2024 Bonneview Dr
- 2177 Bonneview Dr
- 861 E Millbrook Way
- 957 Chelsea Dr
- 530 E 1800 S Unit 51
- 490 E 1800 S
- 2033 Bountiful Blvd
- 1568 Cave Hollow Way
- 2049 Bountiful Blvd
- 1591 Cave Hollow Way
- 2067 Bountiful Blvd
- 2067 Bountiful Blvd Unit 29
- 2027 Mapleview Dr
- 2037 Mapleview Dr
- 2037 Mapleview Dr Unit 128
- 2021 Mapleview Dr
- 2021 Mapleview Dr Unit 248
- 2041 Mapleview Dr Unit 129
- 2031 Mapleview Dr Unit 127
- 2017 Mapleview Dr
- 2011 Mapleview Dr
- 1612 Cave Hollow Way
- 2007 Mapleview Dr
- 1910 S High Pointe Dr
- 1910 High Pointe Dr
- 1890 S High Pointe Dr Unit 9