Estimated Value: $854,000 - $1,170,518
5
Beds
3
Baths
5,763
Sq Ft
$176/Sq Ft
Est. Value
About This Home
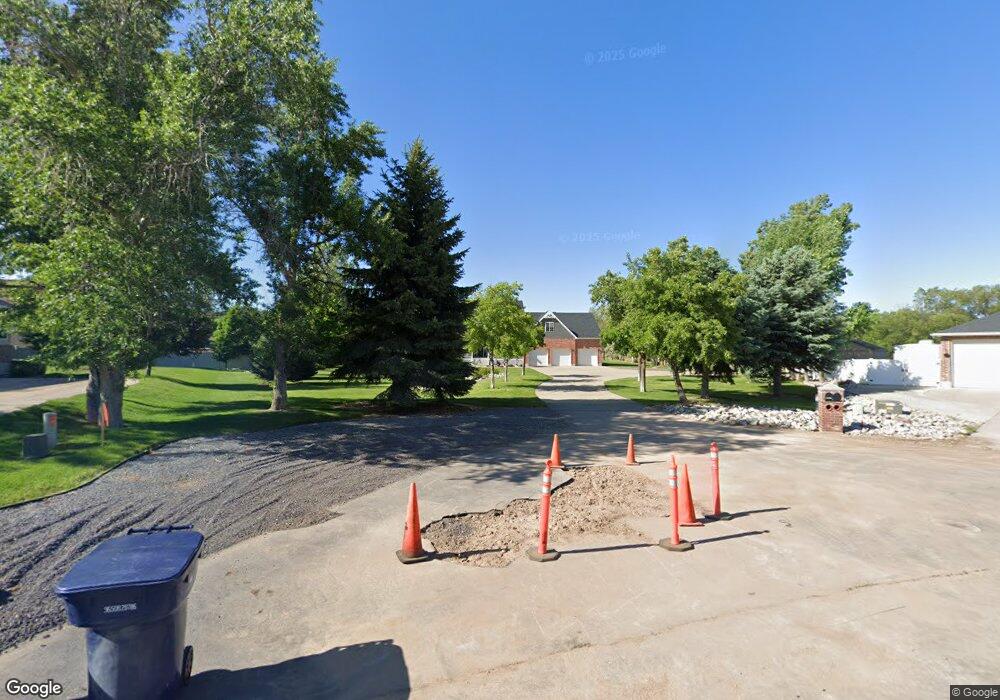
This home is located at 1540 E 6800 S, Ogden, UT 84405 and is currently estimated at $1,012,880, approximately $175 per square foot. 1540 E 6800 S is a home located in Weber County with nearby schools including H Guy Child School, South Ogden Junior High School, and Bonneville High School.
Ownership History
Date
Name
Owned For
Owner Type
Purchase Details
Closed on
Sep 25, 2017
Sold by
Gee Charles
Bought by
Gee Charles M and Gee Tina M
Current Estimated Value
Home Financials for this Owner
Home Financials are based on the most recent Mortgage that was taken out on this home.
Original Mortgage
$333,000
Outstanding Balance
$230,930
Interest Rate
3.89%
Mortgage Type
New Conventional
Estimated Equity
$781,950
Purchase Details
Closed on
Jul 8, 2009
Sold by
Gee Charles M
Bought by
Gee Charles
Home Financials for this Owner
Home Financials are based on the most recent Mortgage that was taken out on this home.
Original Mortgage
$360,000
Interest Rate
5.25%
Mortgage Type
New Conventional
Purchase Details
Closed on
Jan 28, 2003
Sold by
Higgs Owen Milo and Higgs Janice A
Bought by
Gee Charles M and Gee Eva L
Create a Home Valuation Report for This Property
The Home Valuation Report is an in-depth analysis detailing your home's value as well as a comparison with similar homes in the area
Home Values in the Area
Average Home Value in this Area
Purchase History
| Date | Buyer | Sale Price | Title Company |
|---|---|---|---|
| Gee Charles M | -- | First American Title Ins Co | |
| Gee Charles | -- | Servicelink Aliquippa | |
| Gee Charles M | -- | Bonneville Title |
Source: Public Records
Mortgage History
| Date | Status | Borrower | Loan Amount |
|---|---|---|---|
| Open | Gee Charles M | $333,000 | |
| Closed | Gee Charles | $360,000 |
Source: Public Records
Tax History Compared to Growth
Tax History
| Year | Tax Paid | Tax Assessment Tax Assessment Total Assessment is a certain percentage of the fair market value that is determined by local assessors to be the total taxable value of land and additions on the property. | Land | Improvement |
|---|---|---|---|---|
| 2025 | $6,190 | $1,110,783 | $259,594 | $851,189 |
| 2024 | $5,735 | $606,573 | $154,251 | $452,322 |
| 2023 | $5,581 | $582,950 | $144,533 | $438,417 |
| 2022 | $4,720 | $494,450 | $122,871 | $371,579 |
| 2021 | $3,591 | $702,000 | $157,000 | $545,000 |
| 2020 | $3,235 | $584,000 | $125,250 | $458,750 |
| 2019 | $3,276 | $568,000 | $100,250 | $467,750 |
| 2018 | $3,032 | $494,000 | $100,250 | $393,750 |
| 2017 | $2,712 | $420,000 | $100,250 | $319,750 |
| 2016 | $2,390 | $206,623 | $54,688 | $151,935 |
| 2015 | $2,439 | $206,623 | $54,688 | $151,935 |
| 2014 | $2,338 | $196,359 | $54,688 | $141,671 |
Source: Public Records
Map
Nearby Homes
- 1645 E 6800 S
- 1308 E Canyon Dr
- 1577 E South Weber Dr Unit 3
- 7274 S 1600 E
- 7320 S 1250 E
- 1403 E 6175 S
- 1411 E 6175 S
- 7212 S Harolds Way
- 1080 E Lester Dr
- 1647 E Bateman Way
- 7427 Shay Ln
- 7496 S 1740 E
- 1058 E South Bench Dr Unit 3
- 975 E 6600 S Unit 41
- 975 E 6600 S Unit 66
- 975 E 6600 S Unit 5
- 975 E 6600 S Unit 89
- 975 E 6600 S Unit 7
- 1995 E 6225 S
- 1947 E 7470 S