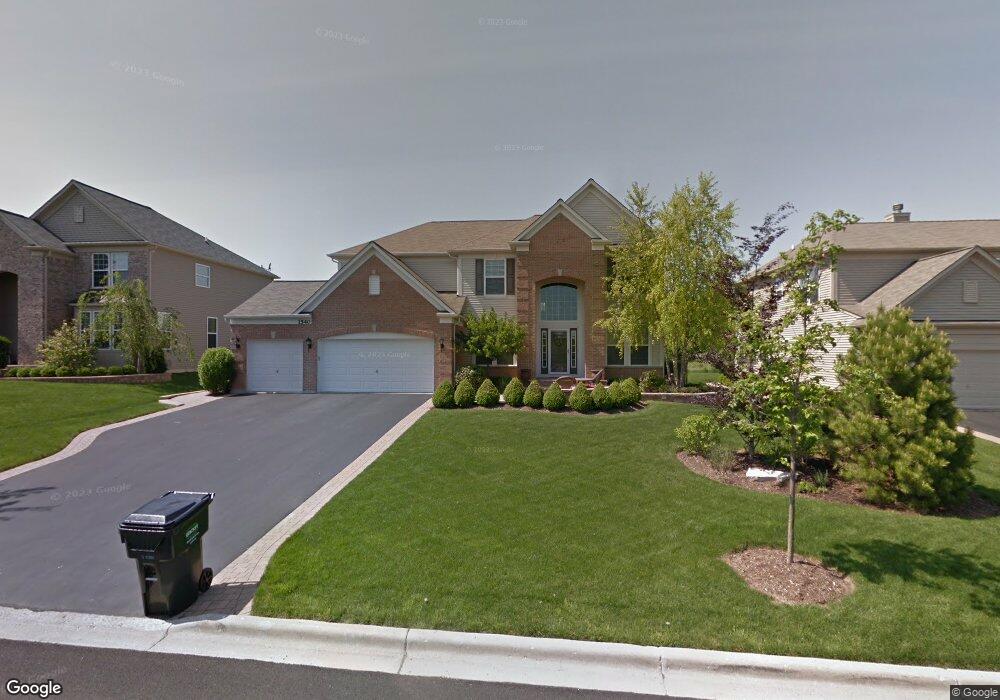
1540 Mcclellan Dr Lindenhurst, IL 60046
Estimated Value: $558,000 - $594,000
4
Beds
3
Baths
3,200
Sq Ft
$180/Sq Ft
Est. Value
About This Home
This home is located at 1540 Mcclellan Dr, Lindenhurst, IL 60046 and is currently estimated at $576,762, approximately $180 per square foot. 1540 Mcclellan Dr is a home located in Lake County with nearby schools including Lakes Community High School.
Ownership History
Date
Name
Owned For
Owner Type
Purchase Details
Closed on
Aug 13, 2010
Sold by
Stoelting Lowell and Stoelting Cynthia
Bought by
Partyka Joseph and Partyka Jessica
Current Estimated Value
Home Financials for this Owner
Home Financials are based on the most recent Mortgage that was taken out on this home.
Original Mortgage
$250,000
Outstanding Balance
$164,855
Interest Rate
4.49%
Mortgage Type
New Conventional
Estimated Equity
$411,907
Purchase Details
Closed on
Oct 18, 2005
Sold by
Pulte Homes
Bought by
Stoelting Lowell D and Stoelting Cynthia L
Home Financials for this Owner
Home Financials are based on the most recent Mortgage that was taken out on this home.
Original Mortgage
$359,650
Interest Rate
5.89%
Mortgage Type
Fannie Mae Freddie Mac
Create a Home Valuation Report for This Property
The Home Valuation Report is an in-depth analysis detailing your home's value as well as a comparison with similar homes in the area
Home Values in the Area
Average Home Value in this Area
Purchase History
| Date | Buyer | Sale Price | Title Company |
|---|---|---|---|
| Partyka Joseph | $365,000 | Chicago Title Insurance Co | |
| Stoelting Lowell D | $470,000 | -- |
Source: Public Records
Mortgage History
| Date | Status | Borrower | Loan Amount |
|---|---|---|---|
| Open | Partyka Joseph | $250,000 | |
| Previous Owner | Stoelting Lowell D | $359,650 |
Source: Public Records
Tax History
| Year | Tax Paid | Tax Assessment Tax Assessment Total Assessment is a certain percentage of the fair market value that is determined by local assessors to be the total taxable value of land and additions on the property. | Land | Improvement |
|---|---|---|---|---|
| 2024 | $13,891 | $150,212 | $19,346 | $130,866 |
| 2023 | $13,305 | $132,719 | $17,093 | $115,626 |
| 2022 | $13,305 | $122,339 | $18,954 | $103,385 |
| 2021 | $12,678 | $113,645 | $17,607 | $96,038 |
| 2020 | $13,072 | $115,615 | $17,912 | $97,703 |
| 2019 | $14,806 | $122,131 | $18,922 | $103,209 |
| 2018 | $14,844 | $126,737 | $26,232 | $100,505 |
| 2017 | $14,457 | $123,357 | $25,532 | $97,825 |
| 2016 | $14,782 | $118,362 | $24,498 | $93,864 |
| 2015 | $14,150 | $110,546 | $22,880 | $87,666 |
| 2014 | $12,001 | $105,480 | $19,505 | $85,975 |
| 2012 | $11,913 | $105,989 | $19,599 | $86,390 |
Source: Public Records
Map
Nearby Homes
- 1650 Natures Way
- 1896 E Vista Terrace
- 527 Northgate Rd Unit 28
- 433 Woodland Trail
- 1903 S Shore Cove
- 420 Woodland Trail
- 434 Woodland Trail
- 428 Woodland Trail
- 1764 S Port Dr
- 1768 S Port Dr
- 1772 S Port Dr
- 533 N Beck Rd Unit 28
- 20215 W Miller Rd
- 405 Woodland Trail
- 38947 Deep Lake Rd
- 1245 Prairie Ridge Trail
- 1249 Prairie Ridge Trail
- 1253 Prairie Ridge Trail
- 1288 Prairie Ridge Trail
- 1261 Prairie Ridge Trail
- 1550 Mcclellan Dr
- 1530 Mcclellan Dr
- 1520 Mcclellan Dr
- 1560 Mcclellan Dr
- 1545 Mcclellan Dr
- 1555 Mcclellan Dr
- 1510 Mcclellan Dr
- 1565 Mcclellan Dr
- 1570 Mcclellan Dr
- 785 Porter Cir
- 784 Porter Cir
- 1500 Mcclellan Dr
- 1580 Mcclellan Dr
- 781 Porter Cir
- 1575 Mcclellan Dr
- 824 Wedgewood Ct
- 780 Porter Cir
- 818 Wedgewood Ct
- 777 Porter Cir
- 1490 Mcclellan Dr
Your Personal Tour Guide
Ask me questions while you tour the home.