Estimated Value: $583,000
--
Bed
--
Bath
1,800
Sq Ft
$324/Sq Ft
Est. Value
About This Home
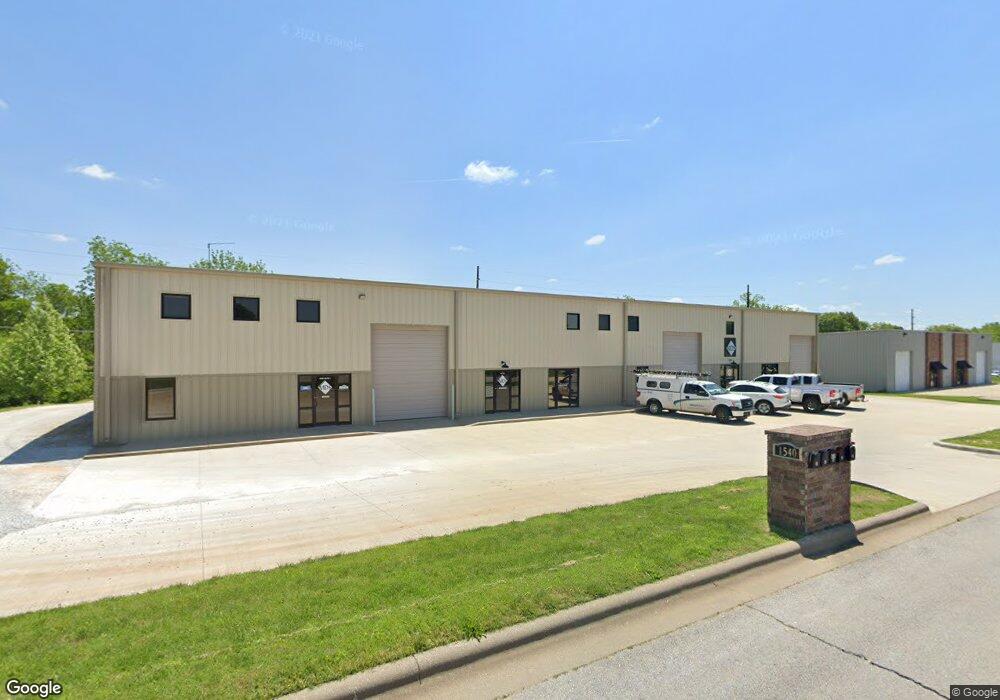
This home is located at 1540 N Commercial Rd Unit 4, Nixa, MO 65714 and is currently estimated at $583,000, approximately $323 per square foot. 1540 N Commercial Rd Unit 4 is a home located in Christian County with nearby schools including High Pointe Elementary School, Summit Intermediate School, and Nixa Junior High School.
Ownership History
Date
Name
Owned For
Owner Type
Purchase Details
Closed on
Feb 18, 2021
Sold by
Jn Properties Llc
Bought by
Lazy J Properties Llc
Current Estimated Value
Home Financials for this Owner
Home Financials are based on the most recent Mortgage that was taken out on this home.
Original Mortgage
$585,000
Outstanding Balance
$522,765
Interest Rate
2.65%
Mortgage Type
Future Advance Clause Open End Mortgage
Estimated Equity
$60,235
Purchase Details
Closed on
Feb 8, 2008
Sold by
Finley Homes Llc
Bought by
Jn Properties Llc
Home Financials for this Owner
Home Financials are based on the most recent Mortgage that was taken out on this home.
Original Mortgage
$550,000
Interest Rate
5.88%
Mortgage Type
Future Advance Clause Open End Mortgage
Purchase Details
Closed on
Jul 31, 2007
Sold by
Rook Knight Properties Llc
Bought by
Finley Homes Llc
Home Financials for this Owner
Home Financials are based on the most recent Mortgage that was taken out on this home.
Original Mortgage
$376,000
Interest Rate
6.64%
Mortgage Type
Construction
Create a Home Valuation Report for This Property
The Home Valuation Report is an in-depth analysis detailing your home's value as well as a comparison with similar homes in the area
Home Values in the Area
Average Home Value in this Area
Purchase History
| Date | Buyer | Sale Price | Title Company |
|---|---|---|---|
| Lazy J Properties Llc | -- | Fidelity Title Agency | |
| Jn Properties Llc | -- | None Available | |
| Finley Homes Llc | -- | None Available |
Source: Public Records
Mortgage History
| Date | Status | Borrower | Loan Amount |
|---|---|---|---|
| Open | Lazy J Properties Llc | $585,000 | |
| Previous Owner | Jn Properties Llc | $550,000 | |
| Previous Owner | Finley Homes Llc | $376,000 |
Source: Public Records
Tax History Compared to Growth
Tax History
| Year | Tax Paid | Tax Assessment Tax Assessment Total Assessment is a certain percentage of the fair market value that is determined by local assessors to be the total taxable value of land and additions on the property. | Land | Improvement |
|---|---|---|---|---|
| 2024 | $10,887 | $173,540 | -- | -- |
| 2023 | $10,887 | $173,540 | $0 | $0 |
| 2022 | $9,109 | $145,020 | $0 | $0 |
| 2021 | $9,114 | $145,020 | $0 | $0 |
| 2020 | $9,508 | $145,020 | $0 | $0 |
| 2019 | $9,508 | $145,020 | $0 | $0 |
| 2018 | $8,853 | $145,020 | $0 | $0 |
| 2017 | $8,853 | $145,020 | $0 | $0 |
| 2016 | $8,571 | $142,660 | $0 | $0 |
| 2015 | $8,583 | $142,660 | $142,660 | $0 |
| 2014 | $7,491 | $127,620 | $0 | $0 |
| 2013 | $7,502 | $127,620 | $0 | $0 |
| 2011 | -- | $238,780 | $0 | $0 |
Source: Public Records
Map
Nearby Homes
- 608 E Penzance Dr
- 824 E Kings Mead Cir Unit 1
- 820 E Brewer Ave
- 1398 N Sandy Creek Cir Unit 2
- 828 E Kings Mead Cir Unit 3
- 1362 N Sandy Creek Cir Unit 4
- 1649 N Feather Crest Dr
- 1396 N Sandy Creek Cir Unit 2
- 823 E Donegal Cir
- 2074 Cc Hwy
- 1363 N Maxine Ave
- 1368 N Sandy Creek Cir Unit 4
- 720 E Penzance Cir
- 1653 N Old Castle Rd
- 1327 N Maxine Ave
- 1677 N State Highway Cc
- 736 E Penzance Cir
- Obsidian B Plan at Walker Estates
- 1383 N Maxine Ave
- Diamond Plan at Walker Estates
- 1540 N Commercial Rd Unit 2&3
- 1540 N Commercial Rd Unit 5
- 1540 N Commercial Rd
- 1532 N Commercial Rd
- 1548 N Commercial Rd
- 1563 Fairway Ln
- 1575 Fairway Ln
- 1543 N Commercial Rd Unit Ste 6
- 1515 Fairway Ln
- 1507 Fairway Ln
- 1552 Fairway Ln
- 568 Walnut Grove Cir
- 556 E Hillwallen Place
- 1599 Fairway Ln
- 1520 N Commercial Rd
- 1556 N Commercial Rd
- 569 E Hillwallen Place
- 569 Walnut Grove Cir
- 578 Walnut Grove Cir
- 568 E Hillwallen Place