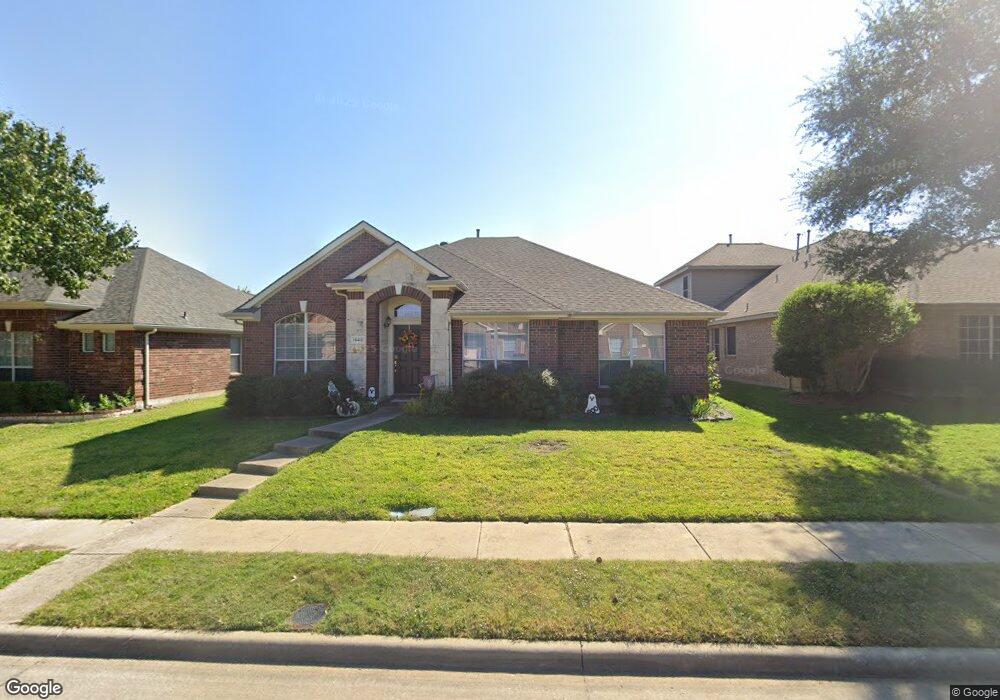
1540 Outerbridge Dr Allen, TX 75002
North East Allen NeighborhoodEstimated Value: $439,000 - $462,000
4
Beds
2
Baths
2,030
Sq Ft
$221/Sq Ft
Est. Value
About This Home
This home is located at 1540 Outerbridge Dr, Allen, TX 75002 and is currently estimated at $449,236, approximately $221 per square foot. 1540 Outerbridge Dr is a home located in Collin County with nearby schools including James & Margie Marion Elementary School, Walter & Lois Curtis Middle School, and Lowery Freshman Center.
Ownership History
Date
Name
Owned For
Owner Type
Purchase Details
Closed on
Jul 8, 2016
Sold by
Actagen Investment Group Llc
Bought by
Marsh Catherine C
Current Estimated Value
Home Financials for this Owner
Home Financials are based on the most recent Mortgage that was taken out on this home.
Original Mortgage
$216,000
Interest Rate
3.64%
Purchase Details
Closed on
Nov 8, 2007
Sold by
Evans Curtis Jack and Evans April D
Bought by
Vancleve Angela L and Van Cleve Tracey L
Home Financials for this Owner
Home Financials are based on the most recent Mortgage that was taken out on this home.
Original Mortgage
$136,000
Interest Rate
6.42%
Purchase Details
Closed on
Sep 8, 2003
Sold by
Rh Of Texas Lp
Bought by
Evans Curtis Jack and Evans April D
Home Financials for this Owner
Home Financials are based on the most recent Mortgage that was taken out on this home.
Original Mortgage
$163,719
Interest Rate
6.31%
Create a Home Valuation Report for This Property
The Home Valuation Report is an in-depth analysis detailing your home's value as well as a comparison with similar homes in the area
Home Values in the Area
Average Home Value in this Area
Purchase History
| Date | Buyer | Sale Price | Title Company |
|---|---|---|---|
| Marsh Catherine C | -- | Republic Title Of Texas | |
| Vancleve Angela L | -- | Rtt | |
| Evans Curtis Jack | -- | -- |
Source: Public Records
Mortgage History
| Date | Status | Borrower | Loan Amount |
|---|---|---|---|
| Previous Owner | Marsh Catherine C | $216,000 | |
| Previous Owner | Vancleve Angela L | $136,000 | |
| Previous Owner | Evans Curtis Jack | $163,719 |
Source: Public Records
Tax History
| Year | Tax Paid | Tax Assessment Tax Assessment Total Assessment is a certain percentage of the fair market value that is determined by local assessors to be the total taxable value of land and additions on the property. | Land | Improvement |
|---|---|---|---|---|
| 2025 | $3,602 | $415,730 | $125,000 | $337,408 |
| 2024 | $4,468 | $377,936 | $125,000 | $320,480 |
| 2023 | $4,468 | $343,578 | $115,000 | $323,790 |
| 2022 | $6,201 | $312,344 | $100,000 | $293,525 |
| 2021 | $6,037 | $283,949 | $65,000 | $218,949 |
| 2020 | $6,091 | $276,363 | $65,000 | $211,363 |
| 2019 | $6,387 | $276,480 | $65,000 | $211,480 |
| 2018 | $6,644 | $282,460 | $65,000 | $217,460 |
| 2017 | $6,207 | $263,898 | $65,000 | $198,898 |
| 2016 | $5,399 | $225,000 | $60,000 | $165,000 |
| 2015 | $4,345 | $209,000 | $47,000 | $162,000 |
Source: Public Records
Map
Nearby Homes
- 1578 Mahogany Dr
- 1513 Creek Springs Dr
- 1306 Cedar Springs Dr
- 1404 Settlers Ct
- 1541 Sandstone Dr
- 1550 Charleston Dr
- 1430 Silver Spur Dr
- 1408 Creek Springs Dr
- 1400 E Exchange Pkwy
- 1309 Hazelwood Dr
- 1719 Live Oak Ln
- 1809 Grand Canyon Way
- 1414 Country Ln
- 907 Ozark Dr
- 1819 Grand Canyon Way
- 1207 Aberdeen Dr
- 1323 Springview Dr
- 1320 Red River Ln
- 1201 Sandy Creek Dr
- 1323 Rivercrest Blvd
- 1538 Outerbridge Dr
- 1542 Outerbridge Dr
- 1536 Outerbridge Dr
- 1539 Sandlewood Dr
- 1544 Outerbridge Dr
- 1535 Sandlewood Dr
- 1539 Outerbridge Dr
- 1537 Outerbridge Dr
- 1534 Outerbridge Dr
- 1541 Outerbridge Dr
- 1552 Prairie View Dr
- 1535 Outerbridge Dr
- 1557 Hansberry Dr
- 1533 Sandlewood Dr
- 1543 Outerbridge Dr
- 1555 Hansberry Dr
- 1555 Hansberry Dr
- 1533 Outerbridge Dr
- 1545 Outerbridge Dr
- 1553 Hansberry Dr
Your Personal Tour Guide
Ask me questions while you tour the home.