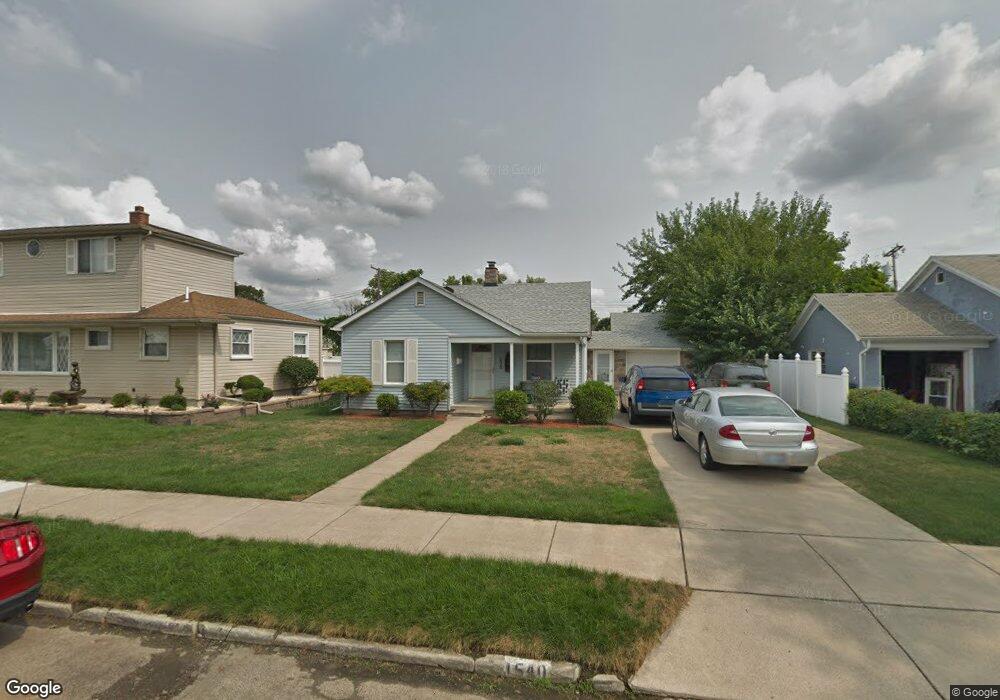
1540 Warwick Ave Lincoln Park, MI 48146
Estimated Value: $118,000 - $149,000
--
Bed
1
Bath
865
Sq Ft
$162/Sq Ft
Est. Value
About This Home
This home is located at 1540 Warwick Ave, Lincoln Park, MI 48146 and is currently estimated at $139,912, approximately $161 per square foot. 1540 Warwick Ave is a home located in Wayne County with nearby schools including Lafayette School, Lincoln Park Middle School, and Lincoln Park High School.
Ownership History
Date
Name
Owned For
Owner Type
Purchase Details
Closed on
Apr 12, 2023
Sold by
Jasso Luis
Bought by
Colmenares-Gutierrez Jhonald J and Zeledon-Paniagua Erika
Current Estimated Value
Home Financials for this Owner
Home Financials are based on the most recent Mortgage that was taken out on this home.
Original Mortgage
$127,645
Outstanding Balance
$124,130
Interest Rate
6.65%
Mortgage Type
FHA
Estimated Equity
$15,782
Purchase Details
Closed on
Nov 9, 2006
Sold by
Ortiz James and Ortiz Sandra
Bought by
Jp Morgan Chase Bank
Purchase Details
Closed on
May 28, 1998
Sold by
Dennis Colleen and Dennis John
Bought by
Ortiz James
Purchase Details
Closed on
Feb 20, 1998
Sold by
Hud
Bought by
Dennis John K
Purchase Details
Closed on
Nov 11, 1997
Sold by
Source One Mortgage Serv
Bought by
Secretary Of Housing & Urban Dev
Purchase Details
Closed on
Sep 27, 1996
Sold by
Busch Rhonda J
Bought by
Dawn M Priebe
Create a Home Valuation Report for This Property
The Home Valuation Report is an in-depth analysis detailing your home's value as well as a comparison with similar homes in the area
Home Values in the Area
Average Home Value in this Area
Purchase History
| Date | Buyer | Sale Price | Title Company |
|---|---|---|---|
| Colmenares-Gutierrez Jhonald J | $130,000 | Michigan Title Insurance Agenc | |
| Jp Morgan Chase Bank | $71,400 | None Available | |
| Ortiz James | $66,000 | -- | |
| Dennis John K | $40,000 | -- | |
| Secretary Of Housing & Urban Dev | -- | -- | |
| Dawn M Priebe | $55,900 | -- |
Source: Public Records
Mortgage History
| Date | Status | Borrower | Loan Amount |
|---|---|---|---|
| Open | Colmenares-Gutierrez Jhonald J | $127,645 | |
| Closed | Colmenares-Gutierrez Jhonald J | $10,000 |
Source: Public Records
Tax History Compared to Growth
Tax History
| Year | Tax Paid | Tax Assessment Tax Assessment Total Assessment is a certain percentage of the fair market value that is determined by local assessors to be the total taxable value of land and additions on the property. | Land | Improvement |
|---|---|---|---|---|
| 2025 | $2,748 | $76,100 | $0 | $0 |
| 2024 | $2,748 | $63,200 | $0 | $0 |
| 2023 | $1,048 | $51,800 | $0 | $0 |
| 2022 | $1,661 | $44,000 | $0 | $0 |
| 2021 | $1,620 | $41,200 | $0 | $0 |
| 2020 | $1,603 | $30,600 | $0 | $0 |
| 2019 | $1,342 | $25,100 | $0 | $0 |
| 2018 | $1,345 | $21,100 | $0 | $0 |
| 2017 | $668 | $20,800 | $0 | $0 |
| 2016 | $1,543 | $21,600 | $0 | $0 |
| 2015 | $2,120 | $21,200 | $0 | $0 |
| 2013 | $2,270 | $23,600 | $0 | $0 |
| 2012 | $2,147 | $24,600 | $6,700 | $17,900 |
Source: Public Records
Map
Nearby Homes
- 1672 Lafayette Blvd
- 1681 Lafayette Blvd
- 1532 Euclid St
- 1563 Russell Ave
- 1382 Euclid St
- 1463 Cicotte Ave
- 1458 Cicotte Ave
- 1383 Cicotte Ave
- 1565 University Ave
- 1424 Cicotte Ave
- 1575 Philomene Blvd
- 1370 Garfield Ave
- 1267 Fort Park Blvd
- 1558 College Ave
- 1187 Park Ave
- 1654 Chandler Ave
- 1582 Chandler Ave
- 1865 Euclid St
- 1506 Chandler Ave
- 1428 Chandler Ave
- 1548 Warwick Ave
- 1532 Warwick Ave
- 1524 Warwick Ave
- 1552 Warwick Ave
- 1531 Oconnor Ave
- 1539 Oconnor Ave
- 1543 Oconnor Ave
- 1523 Oconnor Ave
- 1556 Warwick Ave
- 1547 Oconnor Ave
- 1533 Warwick Ave
- 1539 Warwick Ave
- 1527 Warwick Ave
- 1551 Oconnor Ave
- 1628 Lafayette Blvd
- 1632 Lafayette Blvd
- 1560 Warwick Ave
- 1622 Lafayette Blvd
- 1616 Lafayette Blvd
- 1555 Oconnor Ave