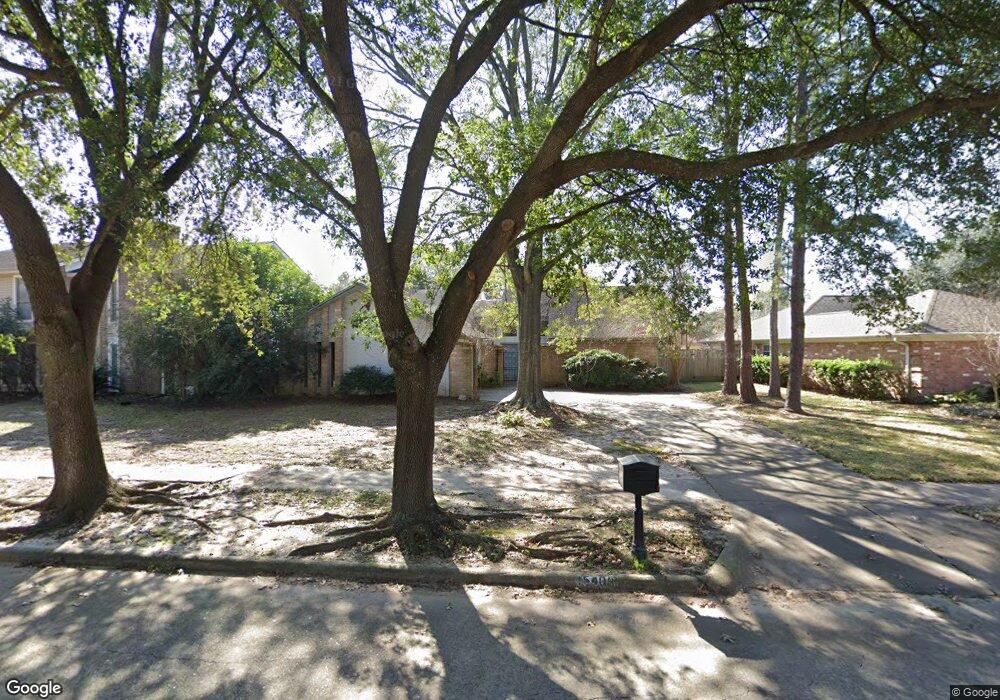
15403 Forest Trails Dr Houston, TX 77095
Copperfield NeighborhoodEstimated Value: $272,669 - $291,000
3
Beds
2
Baths
1,867
Sq Ft
$152/Sq Ft
Est. Value
About This Home
This home is located at 15403 Forest Trails Dr, Houston, TX 77095 and is currently estimated at $284,417, approximately $152 per square foot. 15403 Forest Trails Dr is a home located in Harris County with nearby schools including Fiest Elementary School, Labay Middle School, and Cypress Falls High School.
Ownership History
Date
Name
Owned For
Owner Type
Purchase Details
Closed on
Oct 29, 2002
Sold by
Powell Danny D and Powell Cynthia Y
Bought by
Orr Lucinda L
Current Estimated Value
Home Financials for this Owner
Home Financials are based on the most recent Mortgage that was taken out on this home.
Original Mortgage
$114,845
Interest Rate
6.16%
Purchase Details
Closed on
Mar 20, 2001
Sold by
Gorrell Grant E and Gorrell Brenda Kay
Bought by
Powell Danny D and Powell Cynthia Y
Home Financials for this Owner
Home Financials are based on the most recent Mortgage that was taken out on this home.
Original Mortgage
$39,000
Interest Rate
6.95%
Purchase Details
Closed on
Oct 13, 1995
Sold by
Mullikin George G and Mullikin Cynthia A
Bought by
Gorrell Grant E
Home Financials for this Owner
Home Financials are based on the most recent Mortgage that was taken out on this home.
Original Mortgage
$88,800
Interest Rate
7.76%
Create a Home Valuation Report for This Property
The Home Valuation Report is an in-depth analysis detailing your home's value as well as a comparison with similar homes in the area
Home Values in the Area
Average Home Value in this Area
Purchase History
| Date | Buyer | Sale Price | Title Company |
|---|---|---|---|
| Orr Lucinda L | -- | Chicago Title Insurance Co | |
| Powell Danny D | -- | -- | |
| Gorrell Grant E | -- | -- |
Source: Public Records
Mortgage History
| Date | Status | Borrower | Loan Amount |
|---|---|---|---|
| Previous Owner | Orr Lucinda L | $114,845 | |
| Previous Owner | Powell Danny D | $39,000 | |
| Previous Owner | Gorrell Grant E | $88,800 |
Source: Public Records
Tax History Compared to Growth
Tax History
| Year | Tax Paid | Tax Assessment Tax Assessment Total Assessment is a certain percentage of the fair market value that is determined by local assessors to be the total taxable value of land and additions on the property. | Land | Improvement |
|---|---|---|---|---|
| 2025 | $3,914 | $277,405 | $74,794 | $202,611 |
| 2024 | $3,914 | $266,067 | $74,794 | $191,273 |
| 2023 | $3,914 | $298,561 | $74,794 | $223,767 |
| 2022 | $5,296 | $248,964 | $53,424 | $195,540 |
| 2021 | $5,082 | $194,190 | $53,424 | $140,766 |
| 2020 | $5,098 | $188,321 | $44,520 | $143,801 |
| 2019 | $4,981 | $178,664 | $26,712 | $151,952 |
| 2018 | $1,621 | $171,929 | $26,712 | $145,217 |
| 2017 | $4,795 | $171,929 | $26,712 | $145,217 |
| 2016 | $4,474 | $171,929 | $26,712 | $145,217 |
| 2015 | $3,007 | $151,419 | $26,712 | $124,707 |
| 2014 | $3,007 | $133,159 | $26,712 | $106,447 |
Source: Public Records
Map
Nearby Homes
- 8211 Riverglade Dr
- 15339 Glenwood Park Dr
- 15131 New Hastings Dr
- 15010 Chetland Place Dr
- 8203 Green Devon Dr
- 15611 Meadow Village Dr
- 14962 Royal Birkdale St
- 14919 Forest Trails Dr
- 15415 Swan Creek Dr
- 15362 Meadow Village Dr
- 14931 Inverrary Dr
- 15414 Swan Creek Dr
- 7827 Alamar Dr
- 7731 Club Lake Dr
- 15854 Knolls Lodge Dr
- 15918 Pinyon Creek Dr
- 14911 Sandalfoot St
- 8526 Greenleaf Lake Dr
- 15634 Haleys Landing Ln
- Highway 6 N & Huffmeister Rd
- 15315 Forest Trails Dr
- 15407 Forest Trails Dr
- 15402 Quiet Creek Dr
- 15314 Quiet Creek Dr
- 15411 Forest Trails Dr
- 15406 Quiet Creek Dr
- 15310 Quiet Creek Dr
- 8202 Riverglade Dr
- 15307 Forest Trails Dr
- 15415 Forest Trails Dr
- 8202 Greenbank Ln
- 8207 Greenbank Ln
- 15306 Quiet Creek Dr
- 8206 Riverglade Dr
- 15410 Quiet Creek Dr
- 8206 Greenbank Ln
- 15303 Forest Trails Dr
- 15419 Forest Trails Dr
- 15315 Quiet Creek Dr
- 8211 Greenbank Ln