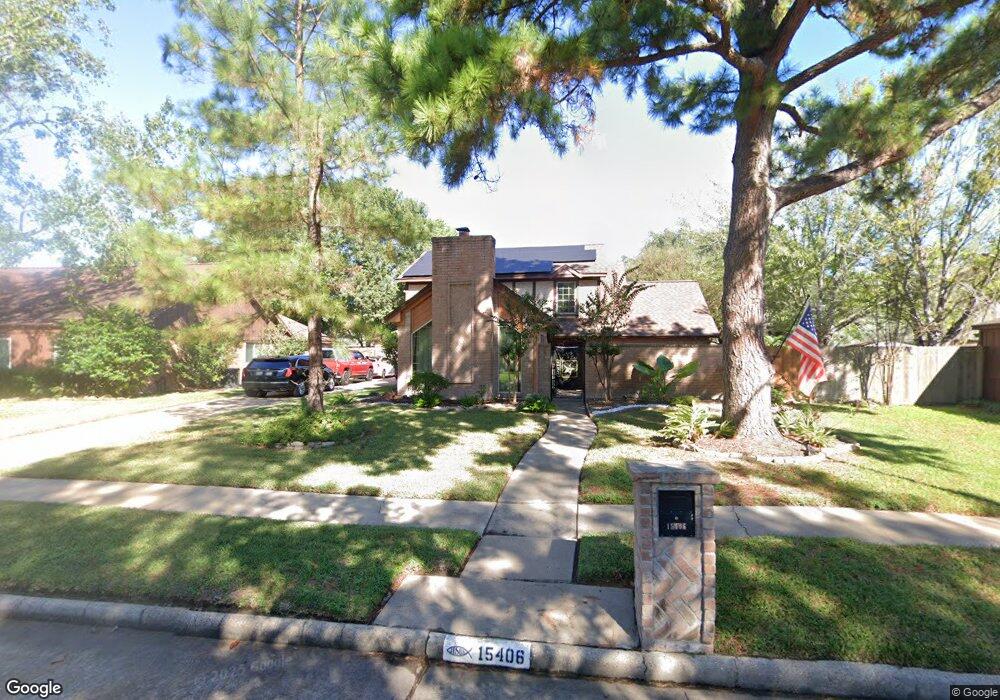
15406 Windy Cove Dr Houston, TX 77095
Copperfield NeighborhoodEstimated Value: $318,000 - $368,176
4
Beds
3
Baths
2,460
Sq Ft
$142/Sq Ft
Est. Value
About This Home
This home is located at 15406 Windy Cove Dr, Houston, TX 77095 and is currently estimated at $349,544, approximately $142 per square foot. 15406 Windy Cove Dr is a home located in Harris County with nearby schools including Fiest Elementary School, Labay Middle School, and Cypress Falls High School.
Ownership History
Date
Name
Owned For
Owner Type
Purchase Details
Closed on
Nov 20, 2007
Sold by
Hud
Bought by
Smith Terry B
Current Estimated Value
Home Financials for this Owner
Home Financials are based on the most recent Mortgage that was taken out on this home.
Original Mortgage
$105,848
Outstanding Balance
$67,109
Interest Rate
6.42%
Mortgage Type
Purchase Money Mortgage
Estimated Equity
$282,435
Purchase Details
Closed on
Apr 10, 2007
Sold by
Wells Fargo Bank Na
Bought by
Hud
Purchase Details
Closed on
Apr 3, 2007
Sold by
Cooper Richard C and Cooper Alicia P
Bought by
Wells Fargo Bank Na
Purchase Details
Closed on
Jul 27, 2004
Sold by
Lehnert Lawrence A and Lehnert Sally K
Bought by
Cooper Richard C and Cooper Alica P
Home Financials for this Owner
Home Financials are based on the most recent Mortgage that was taken out on this home.
Original Mortgage
$161,062
Interest Rate
6.3%
Mortgage Type
FHA
Create a Home Valuation Report for This Property
The Home Valuation Report is an in-depth analysis detailing your home's value as well as a comparison with similar homes in the area
Home Values in the Area
Average Home Value in this Area
Purchase History
| Date | Buyer | Sale Price | Title Company |
|---|---|---|---|
| Smith Terry B | -- | Etc | |
| Hud | -- | None Available | |
| Wells Fargo Bank Na | $166,633 | None Available | |
| Cooper Richard C | -- | Startex Title Company |
Source: Public Records
Mortgage History
| Date | Status | Borrower | Loan Amount |
|---|---|---|---|
| Open | Smith Terry B | $105,848 | |
| Previous Owner | Cooper Richard C | $161,062 |
Source: Public Records
Tax History Compared to Growth
Tax History
| Year | Tax Paid | Tax Assessment Tax Assessment Total Assessment is a certain percentage of the fair market value that is determined by local assessors to be the total taxable value of land and additions on the property. | Land | Improvement |
|---|---|---|---|---|
| 2025 | $2,606 | $374,313 | $77,448 | $296,865 |
| 2024 | $2,606 | $359,153 | $77,448 | $281,705 |
| 2023 | $2,606 | $397,163 | $77,448 | $319,715 |
| 2022 | $6,889 | $320,420 | $55,320 | $265,100 |
| 2021 | $6,611 | $252,603 | $55,320 | $197,283 |
| 2020 | $6,405 | $244,389 | $46,100 | $198,289 |
| 2019 | $5,996 | $236,079 | $27,660 | $208,419 |
| 2018 | $1,892 | $195,523 | $27,660 | $167,863 |
| 2017 | $5,453 | $195,523 | $27,660 | $167,863 |
| 2016 | $5,256 | $195,523 | $27,660 | $167,863 |
| 2015 | $3,571 | $173,574 | $27,660 | $145,914 |
| 2014 | $3,571 | $155,752 | $27,660 | $128,092 |
Source: Public Records
Map
Nearby Homes
- 15611 Meadow Village Dr
- 15339 Glenwood Park Dr
- 15415 Swan Creek Dr
- 15414 Swan Creek Dr
- 15362 Meadow Village Dr
- 8211 Riverglade Dr
- 15634 Haleys Landing Ln
- 8203 Green Devon Dr
- 8526 Greenleaf Lake Dr
- 15610 Tarpon Springs Ct
- 15010 Chetland Place Dr
- 15610 Manorford Ct
- 15627 Kentwater Ct
- 15735 Jamie Lee Dr
- 15131 New Hastings Dr
- 15918 Pinyon Creek Dr
- 9111 Baber Dr
- 8526 Hot Springs Dr
- 15314 Tysor Park Ln
- 9119 Baber Dr
- 15410 Windy Cove Dr
- 8403 Windy Cove Ct
- 8407 Windy Cove Ct
- 15414 Windy Cove Dr
- 15407 Windy Cove Dr
- 15411 Windy Cove Dr
- 8411 Windy Cove Ct
- 15403 Windy Cove Dr
- 15527 Meadow Village Dr
- 15531 Meadow Village Dr
- 15415 Windy Cove Dr
- 15523 Meadow Village Dr
- 15603 Meadow Village Dr
- 15323 Windy Cove Dr
- 15519 Meadow Village Dr
- 8410 Windy Cove Ct
- 15419 Windy Cove Dr
- 15422 Windy Cove Dr
- 8402 Windy Cove Ct
- 15607 Meadow Village Dr