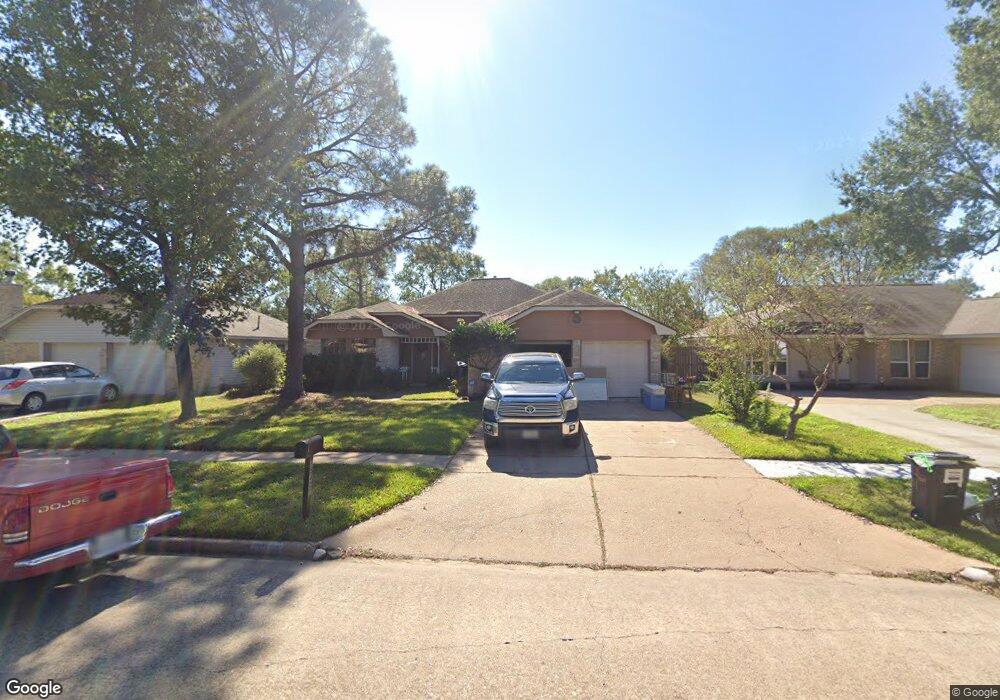
15407 Pebble Lake Dr Houston, TX 77095
Estimated Value: $253,938 - $270,000
3
Beds
2
Baths
1,847
Sq Ft
$143/Sq Ft
Est. Value
About This Home
This home is located at 15407 Pebble Lake Dr, Houston, TX 77095 and is currently estimated at $263,235, approximately $142 per square foot. 15407 Pebble Lake Dr is a home located in Harris County with nearby schools including Fiest Elementary School, Labay Middle School, and Cypress Falls High School.
Ownership History
Date
Name
Owned For
Owner Type
Purchase Details
Closed on
Jul 12, 1994
Sold by
Federal National Mortgage Association
Bought by
Carrizales Bruce R and Carrizales Debra K
Current Estimated Value
Home Financials for this Owner
Home Financials are based on the most recent Mortgage that was taken out on this home.
Original Mortgage
$71,150
Interest Rate
8.52%
Purchase Details
Closed on
Jul 7, 1994
Sold by
Federal Deposit Insurance Corporation
Bought by
Federal National Mortgage Association
Home Financials for this Owner
Home Financials are based on the most recent Mortgage that was taken out on this home.
Original Mortgage
$71,150
Interest Rate
8.52%
Purchase Details
Closed on
Dec 28, 1993
Sold by
Bank United Of Texas Fsb
Bought by
Federal Deposit Insurance Corporation and Fslic Resolution Fund
Create a Home Valuation Report for This Property
The Home Valuation Report is an in-depth analysis detailing your home's value as well as a comparison with similar homes in the area
Home Values in the Area
Average Home Value in this Area
Purchase History
| Date | Buyer | Sale Price | Title Company |
|---|---|---|---|
| Carrizales Bruce R | -- | -- | |
| Federal National Mortgage Association | -- | -- | |
| Federal Deposit Insurance Corporation | -- | -- |
Source: Public Records
Mortgage History
| Date | Status | Borrower | Loan Amount |
|---|---|---|---|
| Closed | Carrizales Bruce R | $71,150 |
Source: Public Records
Tax History Compared to Growth
Tax History
| Year | Tax Paid | Tax Assessment Tax Assessment Total Assessment is a certain percentage of the fair market value that is determined by local assessors to be the total taxable value of land and additions on the property. | Land | Improvement |
|---|---|---|---|---|
| 2025 | $3,488 | $237,892 | $55,010 | $182,882 |
| 2024 | $3,488 | $246,567 | $55,010 | $191,557 |
| 2023 | $3,488 | $257,667 | $55,010 | $202,657 |
| 2022 | $4,845 | $229,863 | $50,127 | $179,736 |
| 2021 | $4,649 | $177,655 | $50,127 | $127,528 |
| 2020 | $4,949 | $182,785 | $41,664 | $141,121 |
| 2019 | $4,703 | $168,698 | $27,017 | $141,681 |
| 2018 | $1,461 | $158,044 | $27,017 | $131,027 |
| 2017 | $4,407 | $158,044 | $27,017 | $131,027 |
| 2016 | $4,045 | $158,044 | $27,017 | $131,027 |
| 2015 | $2,697 | $141,952 | $27,017 | $114,935 |
| 2014 | $2,697 | $125,032 | $22,460 | $102,572 |
Source: Public Records
Map
Nearby Homes
- 15414 Swan Creek Dr
- 15415 Swan Creek Dr
- 15362 Meadow Village Dr
- 15611 Meadow Village Dr
- 15634 Haleys Landing Ln
- 15610 Tarpon Springs Ct
- 15339 Glenwood Park Dr
- 15610 Manorford Ct
- 15627 Kentwater Ct
- 9111 Baber Dr
- 8526 Greenleaf Lake Dr
- 15314 Tysor Park Ln
- 9119 Baber Dr
- 8211 Riverglade Dr
- 15242 Shapiro Springs Ln
- 9303 Rush Mill Ct
- 9203 Baber Run Cir
- 9307 Rush Mill Ct
- 9227 Baber Run Cir
- 15735 Jamie Lee Dr
- 15411 Pebble Lake Dr
- 15403 Pebble Lake Dr
- 15415 Pebble Lake Dr
- 8506 Grove Park Dr
- 15406 Pebble Lake Dr
- 15410 Pebble Lake Dr
- 15402 Pebble Lake Dr
- 15335 Pebble Lake Dr
- 8503 Silver Fir Dr
- 15414 Pebble Lake Dr
- 8502 Grove Park Dr
- 15338 Pebble Lake Dr
- 8502 Silver Fir Dr
- 8506 Silver Fir Dr
- 15423 Pebble Lake Dr
- 15418 Pebble Lake Dr
- 15331 Pebble Lake Dr
- 15334 Pebble Lake Dr
- 8507 Grove Park Dr
- 15410 Swan Creek Dr