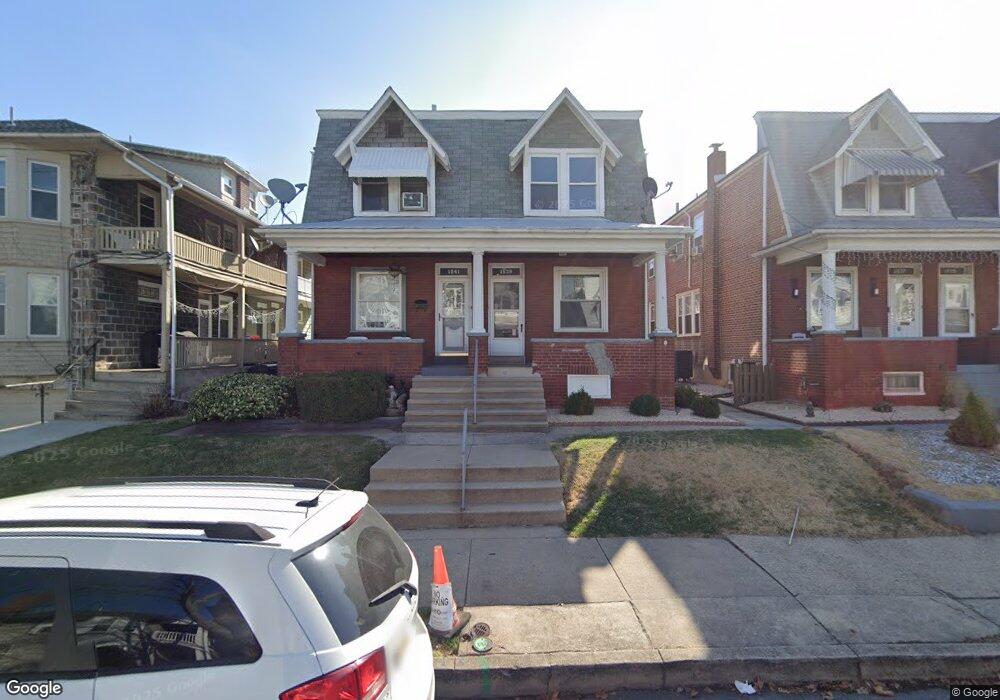
1541 Birch St Reading, PA 19604
College Heights NeighborhoodEstimated Value: $186,021 - $220,000
3
Beds
2
Baths
1,148
Sq Ft
$176/Sq Ft
Est. Value
About This Home
This home is located at 1541 Birch St, Reading, PA 19604 and is currently estimated at $202,005, approximately $175 per square foot. 1541 Birch St is a home located in Berks County with nearby schools including Thirteenth & Union Elementary School, Northeast Middle School, and Reading Senior High School.
Ownership History
Date
Name
Owned For
Owner Type
Purchase Details
Closed on
Jun 21, 2017
Sold by
Viera Federico
Bought by
Viera Federico and Plaza Yahaira
Current Estimated Value
Purchase Details
Closed on
Oct 31, 2008
Sold by
Marvel Wayne A and Marvel Joanne M
Bought by
Viera Federico
Home Financials for this Owner
Home Financials are based on the most recent Mortgage that was taken out on this home.
Original Mortgage
$5,000
Outstanding Balance
$3,282
Interest Rate
6.08%
Mortgage Type
Stand Alone Second
Estimated Equity
$198,723
Purchase Details
Closed on
Jan 9, 2004
Sold by
Collado Lydia M
Bought by
Impink Ryan C
Home Financials for this Owner
Home Financials are based on the most recent Mortgage that was taken out on this home.
Original Mortgage
$59,529
Interest Rate
5.82%
Mortgage Type
FHA
Create a Home Valuation Report for This Property
The Home Valuation Report is an in-depth analysis detailing your home's value as well as a comparison with similar homes in the area
Home Values in the Area
Average Home Value in this Area
Purchase History
| Date | Buyer | Sale Price | Title Company |
|---|---|---|---|
| Viera Federico | -- | None Available | |
| Viera Federico | $85,000 | None Available | |
| Impink Ryan C | $60,000 | -- |
Source: Public Records
Mortgage History
| Date | Status | Borrower | Loan Amount |
|---|---|---|---|
| Open | Viera Federico | $5,000 | |
| Open | Viera Federico | $83,892 | |
| Previous Owner | Impink Ryan C | $59,529 |
Source: Public Records
Tax History
| Year | Tax Paid | Tax Assessment Tax Assessment Total Assessment is a certain percentage of the fair market value that is determined by local assessors to be the total taxable value of land and additions on the property. | Land | Improvement |
|---|---|---|---|---|
| 2025 | $1,637 | $60,300 | $17,300 | $43,000 |
| 2024 | $2,678 | $60,300 | $17,300 | $43,000 |
| 2023 | $2,636 | $60,300 | $17,300 | $43,000 |
| 2022 | $2,636 | $60,300 | $17,300 | $43,000 |
| 2021 | $2,636 | $60,300 | $17,300 | $43,000 |
| 2020 | $2,610 | $60,300 | $17,300 | $43,000 |
| 2019 | $2,610 | $60,300 | $17,300 | $43,000 |
| 2018 | $2,610 | $60,300 | $17,300 | $43,000 |
| 2017 | $2,592 | $60,300 | $17,300 | $43,000 |
| 2016 | $1,481 | $60,300 | $17,300 | $43,000 |
| 2015 | $1,481 | $60,300 | $17,300 | $43,000 |
| 2014 | $1,363 | $60,300 | $17,300 | $43,000 |
Source: Public Records
Map
Nearby Homes
- 1500 N 12th St
- 1425 N 13th St
- 1519 N 11th St
- 1361 Locust St
- 1421 Palm St
- 1231 Perry St
- 1624 N 10th St
- 1347 Mulberry St
- 1343 Mulberry St
- 1357 N 10th St
- 1722 Olive St
- 1649 N 9th St
- 1209 Linden St
- 1302 N 10th St
- 910 Pike St
- 1200 Hampden Blvd
- 0 Rockland St Unit PABK2041018
- 1711 Alsace Rd
- 1139 Mulberry St
- 1026 Hampden Blvd
Your Personal Tour Guide
Ask me questions while you tour the home.