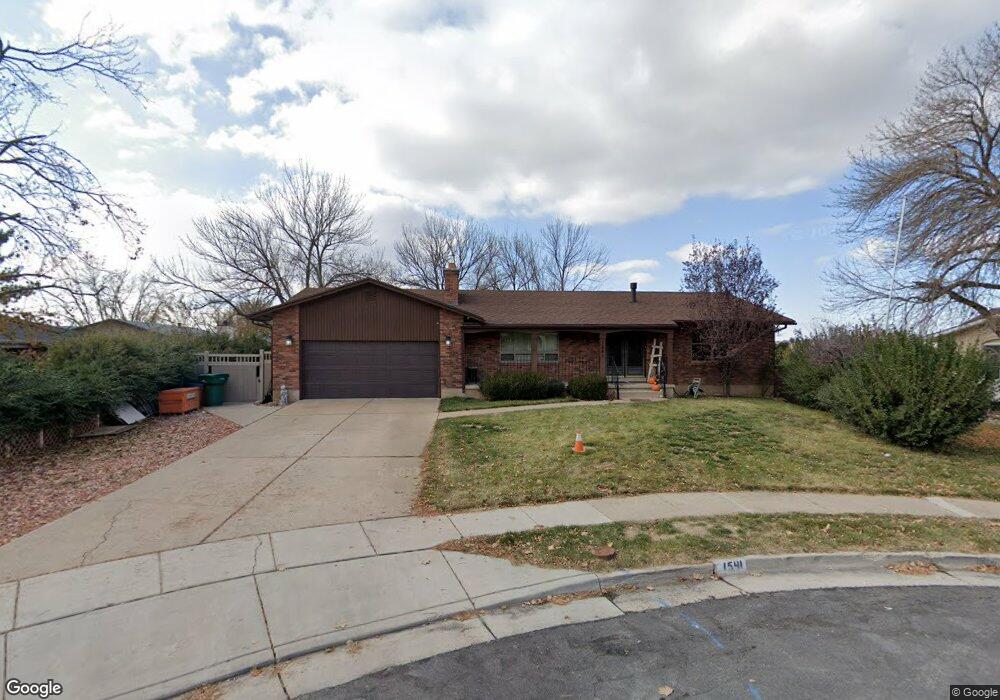
1541 N Cherry Cir Layton, UT 84040
Estimated Value: $492,000 - $599,000
3
Beds
3
Baths
2,394
Sq Ft
$225/Sq Ft
Est. Value
About This Home
This home is located at 1541 N Cherry Cir, Layton, UT 84040 and is currently estimated at $537,603, approximately $224 per square foot. 1541 N Cherry Cir is a home located in Davis County with nearby schools including East Layton Elementary School, Central Davis Junior High School, and Northridge High School.
Ownership History
Date
Name
Owned For
Owner Type
Purchase Details
Closed on
Sep 12, 2024
Sold by
Conroy Shawn W
Bought by
Kunkel Justin Allen
Current Estimated Value
Home Financials for this Owner
Home Financials are based on the most recent Mortgage that was taken out on this home.
Original Mortgage
$467,055
Outstanding Balance
$461,627
Interest Rate
6.73%
Mortgage Type
New Conventional
Estimated Equity
$75,976
Purchase Details
Closed on
Aug 13, 2018
Sold by
Andrews Kenneth Clair
Bought by
Conroy Shawn W
Home Financials for this Owner
Home Financials are based on the most recent Mortgage that was taken out on this home.
Original Mortgage
$319,113
Interest Rate
4.25%
Mortgage Type
FHA
Purchase Details
Closed on
Jan 23, 2008
Sold by
Andrews Kenneth C and Andrews Kathleen A
Bought by
Andrews Kenneth Clair and Andrews Kathleen Ann
Create a Home Valuation Report for This Property
The Home Valuation Report is an in-depth analysis detailing your home's value as well as a comparison with similar homes in the area
Home Values in the Area
Average Home Value in this Area
Purchase History
| Date | Buyer | Sale Price | Title Company |
|---|---|---|---|
| Kunkel Justin Allen | -- | Old Republic Title | |
| Kunkel Justin Allen | -- | Old Republic Title | |
| Conroy Shawn W | -- | Old Republic Title | |
| Conroy Shawn W | -- | Inwest Title | |
| Andrews Kenneth Clair | -- | None Available |
Source: Public Records
Mortgage History
| Date | Status | Borrower | Loan Amount |
|---|---|---|---|
| Open | Kunkel Justin Allen | $467,055 | |
| Closed | Kunkel Justin Allen | $467,055 | |
| Previous Owner | Conroy Shawn W | $319,113 |
Source: Public Records
Tax History
| Year | Tax Paid | Tax Assessment Tax Assessment Total Assessment is a certain percentage of the fair market value that is determined by local assessors to be the total taxable value of land and additions on the property. | Land | Improvement |
|---|---|---|---|---|
| 2025 | $2,583 | $271,150 | $138,419 | $132,731 |
| 2024 | $2,439 | $257,949 | $162,054 | $95,895 |
| 2023 | $2,409 | $449,000 | $215,561 | $233,439 |
| 2022 | $2,549 | $257,950 | $115,883 | $142,067 |
| 2021 | $2,352 | $355,000 | $176,775 | $178,225 |
| 2020 | $2,030 | $294,000 | $144,781 | $149,219 |
| 2019 | $2,002 | $284,000 | $128,977 | $155,023 |
| 2018 | $1,826 | $260,000 | $101,690 | $158,310 |
| 2016 | $1,578 | $115,885 | $53,254 | $62,631 |
| 2015 | $1,501 | $104,665 | $53,254 | $51,411 |
| 2014 | $1,532 | $109,201 | $53,254 | $55,947 |
| 2013 | -- | $92,101 | $20,856 | $71,245 |
Source: Public Records
Map
Nearby Homes
- 1752 N Valley View Dr
- 2231 N Valley View Dr
- 1870 N Valley View Dr Unit 201
- 1954 N 2600 E
- 2547 E 1900 N
- 2509 E 1900 N
- 1332 N 2350 E
- 2855 E Gentile St Unit 1
- 2391 Kays Creek Dr
- 2136 N 2800 E
- 1907 N Bridge Ct
- 2203 E 1200 N
- 2124 E Cherry Ln
- 2563 E 2250 N
- 1960 N 2150 E
- 2113 E 1200 N
- 1975 E 1425 N
- 717 Woodridge Dr
- 1843 Hayes Dr
- 2569 N 2900 E
- 1541 N Cherry Ln
- 1553 N 2850 E Unit 5
- 1565 N 2850 E Unit 6
- 1511 N Hobbs Creek Dr
- 1568 N 2850 E Unit 4
- 1544 N 2800 E
- 1528 N 2800 E
- 1577 N 2850 E Unit 7
- 1562 N 2800 E
- 1582 N 2850 E Unit 3
- 1582 N 2850 E
- 1589 N 2850 E
- 1596 N 2850 E Unit 2
- 1580 N 2800 E
- 1586 N Highway 89
- 1601 N 2850 E
- 1511 N 2800 E
- 1531 N 2800 E
- 1549 N 2800 E
- 1569 N 2800 E
Your Personal Tour Guide
Ask me questions while you tour the home.