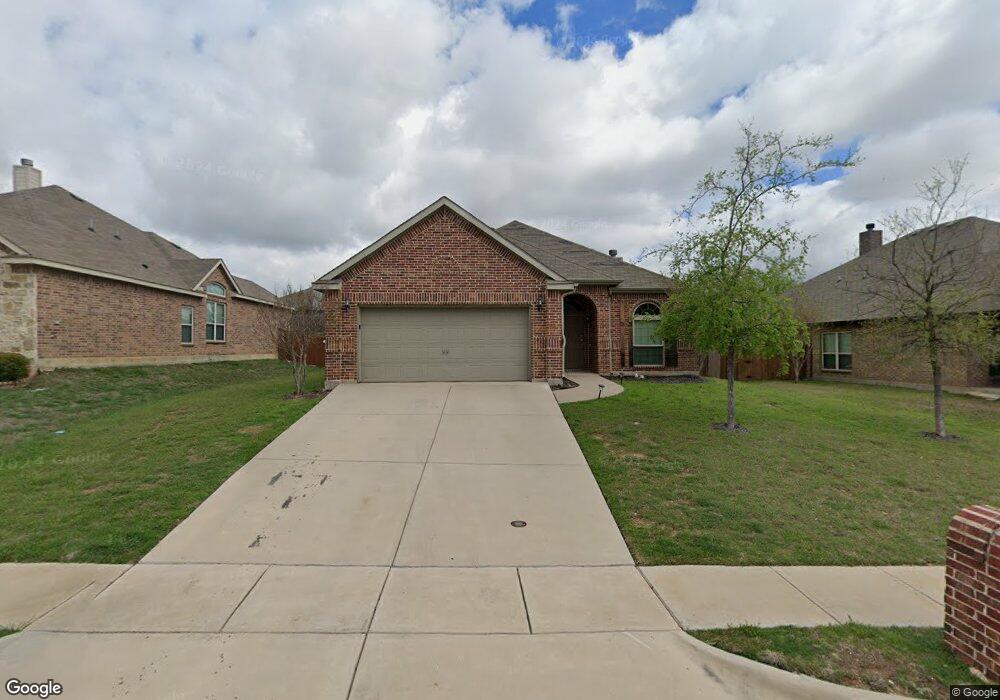
1541 Salado Trail Weatherford, TX 76087
Estimated Value: $349,349 - $392,000
3
Beds
2
Baths
2,009
Sq Ft
$184/Sq Ft
Est. Value
About This Home
This home is located at 1541 Salado Trail, Weatherford, TX 76087 and is currently estimated at $370,587, approximately $184 per square foot. 1541 Salado Trail is a home located in Parker County with nearby schools including Martin Elementary School, Tison Middle School, and Weatherford High School.
Ownership History
Date
Name
Owned For
Owner Type
Purchase Details
Closed on
Jul 31, 2020
Sold by
Coiner Properties Llc
Bought by
Farmer Eddie Bryce and Farmer Cryster K
Current Estimated Value
Home Financials for this Owner
Home Financials are based on the most recent Mortgage that was taken out on this home.
Original Mortgage
$71,550
Outstanding Balance
$63,587
Interest Rate
3.1%
Mortgage Type
Commercial
Estimated Equity
$307,000
Purchase Details
Closed on
Jun 20, 2017
Sold by
Slemmons Kevin W and Slemmons Michele L
Bought by
Csh Property One Llc
Purchase Details
Closed on
Dec 30, 2013
Sold by
Endeavor Wall Homes Llc
Bought by
Slemmons Kevin W and Slemmons Michele L
Home Financials for this Owner
Home Financials are based on the most recent Mortgage that was taken out on this home.
Original Mortgage
$154,471
Interest Rate
4.4%
Mortgage Type
FHA
Create a Home Valuation Report for This Property
The Home Valuation Report is an in-depth analysis detailing your home's value as well as a comparison with similar homes in the area
Home Values in the Area
Average Home Value in this Area
Purchase History
| Date | Buyer | Sale Price | Title Company |
|---|---|---|---|
| Farmer Eddie Bryce | -- | Providence Title Company | |
| Csh Property One Llc | -- | None Available | |
| Slemmons Kevin W | -- | None Available |
Source: Public Records
Mortgage History
| Date | Status | Borrower | Loan Amount |
|---|---|---|---|
| Open | Farmer Eddie Bryce | $71,550 | |
| Previous Owner | Slemmons Kevin W | $154,471 |
Source: Public Records
Tax History Compared to Growth
Tax History
| Year | Tax Paid | Tax Assessment Tax Assessment Total Assessment is a certain percentage of the fair market value that is determined by local assessors to be the total taxable value of land and additions on the property. | Land | Improvement |
|---|---|---|---|---|
| 2025 | $6,238 | $353,915 | $50,000 | $303,915 |
| 2024 | $6,238 | $323,629 | $40,000 | $283,629 |
| 2023 | $6,238 | $377,970 | $40,000 | $337,970 |
| 2022 | $5,628 | $253,720 | $35,000 | $218,720 |
| 2021 | $6,093 | $253,720 | $35,000 | $218,720 |
| 2020 | $5,458 | $225,870 | $30,000 | $195,870 |
| 2019 | $5,768 | $225,870 | $30,000 | $195,870 |
| 2018 | $5,279 | $205,820 | $30,000 | $175,820 |
| 2017 | $5,416 | $205,820 | $30,000 | $175,820 |
| 2016 | $4,678 | $177,780 | $30,000 | $147,780 |
| 2015 | $4,581 | $177,780 | $30,000 | $147,780 |
| 2014 | -- | $160,470 | $30,000 | $130,470 |
Source: Public Records
Map
Nearby Homes
- 1553 Salado Trail
- 1629 Silverstone Dr
- 1529 Sidewinder Trail
- 1624 Sandle Wood Dr
- 1520 Sidewinder Trail
- 1636 Salado Trail
- 1541 Stanchion Way
- 1525 Sand Dollar Trail
- 1605 Stanchion Way
- 705 N Oakridge Dr
- 2712 Sonora Canyon Rd
- 2321 Shamrock Ln
- 2317 Shamrock Ln
- 2300 Shamrock Ln
- 536 Mitchell Blvd
- 532 Mitchell Blvd
- 541 Mitchell Blvd
- 1201 Azle Hwy
- 116 Sandstone Ln
- 544 Waterford Park Blvd
- 1537 Salado Trail
- 1545 Salado Trail
- 1533 Salado Trail
- 1536 Salado Trail
- 1540 Stetson Dr
- 1549 Salado Trail
- 1536 Stetson Dr
- 1544 Salado Trail
- 1540 Salado Tr
- 1544 Stetson Dr
- 1529 Salado Trail
- 1541 Salado Tr
- 1532 Stetson Dr
- 1548 Salado Trail
- 1528 Stetson Dr
- 1525 Salado Trail
- 1528 Salado Trail
- 1548 Stetson Dr
- 1557 Salado Trail
- 1524 Stetson Dr