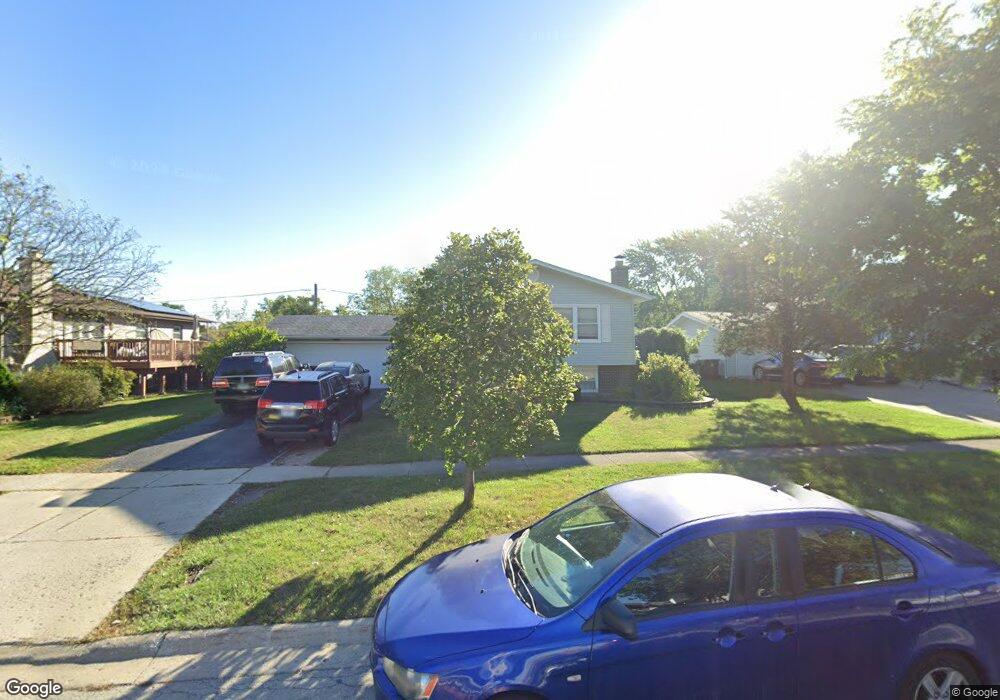
15413 Ridgeland Ave Oak Forest, IL 60452
Estimated Value: $326,000 - $359,000
3
Beds
2
Baths
1,284
Sq Ft
$267/Sq Ft
Est. Value
About This Home
This home is located at 15413 Ridgeland Ave, Oak Forest, IL 60452 and is currently estimated at $343,097, approximately $267 per square foot. 15413 Ridgeland Ave is a home located in Cook County with nearby schools including Lee R Foster Elementary School, Jack Hille Middle School, and Oak Forest High School.
Ownership History
Date
Name
Owned For
Owner Type
Purchase Details
Closed on
Feb 8, 2018
Sold by
Niazi Iftikhar A K
Bought by
Chicago Title Land Trust Company and Trust Number 8002379013
Current Estimated Value
Purchase Details
Closed on
Aug 31, 2004
Sold by
Amato Salvatore R and Amato Mary
Bought by
Niazi Iftikhar A K
Home Financials for this Owner
Home Financials are based on the most recent Mortgage that was taken out on this home.
Original Mortgage
$196,000
Interest Rate
6.08%
Mortgage Type
Unknown
Purchase Details
Closed on
Jan 11, 1994
Sold by
Zalewski David J and Zalewski Rita M
Bought by
Amato Salvatore R and Amato Mary
Home Financials for this Owner
Home Financials are based on the most recent Mortgage that was taken out on this home.
Original Mortgage
$126,947
Interest Rate
7.26%
Mortgage Type
FHA
Create a Home Valuation Report for This Property
The Home Valuation Report is an in-depth analysis detailing your home's value as well as a comparison with similar homes in the area
Home Values in the Area
Average Home Value in this Area
Purchase History
| Date | Buyer | Sale Price | Title Company |
|---|---|---|---|
| Chicago Title Land Trust Company | -- | Chicago Title | |
| Niazi Iftikhar A K | $245,000 | Pntn | |
| Amato Salvatore R | $145,000 | -- |
Source: Public Records
Mortgage History
| Date | Status | Borrower | Loan Amount |
|---|---|---|---|
| Previous Owner | Niazi Iftikhar A K | $196,000 | |
| Previous Owner | Amato Salvatore R | $126,947 |
Source: Public Records
Tax History Compared to Growth
Tax History
| Year | Tax Paid | Tax Assessment Tax Assessment Total Assessment is a certain percentage of the fair market value that is determined by local assessors to be the total taxable value of land and additions on the property. | Land | Improvement |
|---|---|---|---|---|
| 2024 | $7,097 | $26,000 | $3,814 | $22,186 |
| 2023 | $6,527 | $26,000 | $3,814 | $22,186 |
| 2022 | $6,527 | $18,966 | $3,390 | $15,576 |
| 2021 | $6,402 | $18,965 | $3,390 | $15,575 |
| 2020 | $6,245 | $18,965 | $3,390 | $15,575 |
| 2019 | $5,491 | $17,061 | $3,178 | $13,883 |
| 2018 | $5,396 | $17,061 | $3,178 | $13,883 |
| 2017 | $5,438 | $17,061 | $3,178 | $13,883 |
| 2016 | $4,862 | $14,329 | $2,966 | $11,363 |
| 2015 | $4,695 | $14,329 | $2,966 | $11,363 |
| 2014 | $5,126 | $15,732 | $2,966 | $12,766 |
| 2013 | $5,804 | $19,255 | $2,966 | $16,289 |
Source: Public Records
Map
Nearby Homes
- 6230 Boca Rio Dr
- 15200 Pine Dr
- 6501 Forestview Dr
- 6151 Victoria Dr
- 6305 157th St
- 6233 El Morro Ln
- 15524 Pine Rd
- 6345 Parkwood Ct
- 15007 Moorings Ln
- 6251 Bret Dr
- 15754 Arroyo Dr
- 15725 La Paz Ct
- 6860 W Winding Trail Unit 204
- 6840 W Winding Trail Unit 204
- 15459 S 70th Ct
- 5823 Stuart Ln
- 15201 Briar Ln
- 15700 Reynolds Ln
- 5756 Lancaster Dr
- 5726 Lancaster Dr
- 15419 Ridgeland Ave
- 15409 Ridgeland Ave
- 15354 Orogrande Ct
- 15425 Ridgeland Ave
- 15401 Ridgeland Ave
- 15348 Orogrande Ct
- 15360 Orogrande Ct
- 15410 Ridgeland Ave
- 15416 Ridgeland Ave
- 15400 Ridgeland Ave
- 15408 Orogrande Dr
- 15431 Ridgeland Ave
- 15422 Ridgeland Ave
- 15355 Ridgeland Ave
- 15342 Orogrande Ct
- 15416 Orogrande Dr
- 15400 Orogrande Dr
- 15428 Ridgeland Ave
- 15437 Ridgeland Ave
- 6357 Catalina Ave