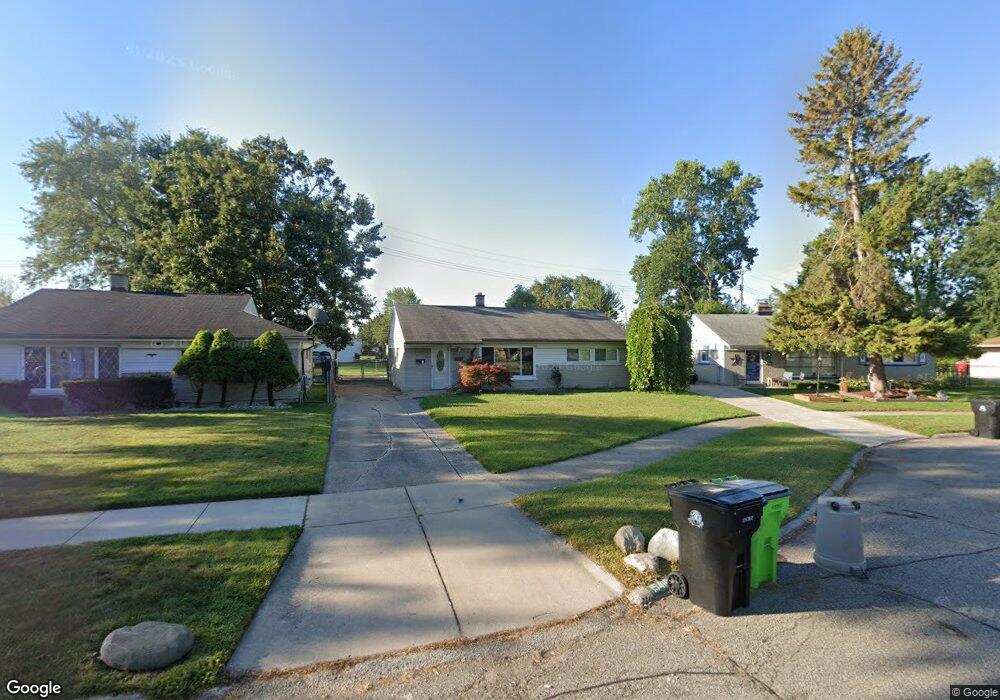
15416 Hill Ct Roseville, MI 48066
Estimated Value: $150,962 - $175,000
3
Beds
1
Bath
1,092
Sq Ft
$148/Sq Ft
Est. Value
About This Home
This home is located at 15416 Hill Ct, Roseville, MI 48066 and is currently estimated at $161,241, approximately $147 per square foot. 15416 Hill Ct is a home located in Macomb County with nearby schools including Dort Elementary School, Joseph G. Steenland Elementary School, and Kaiser Elementary School.
Ownership History
Date
Name
Owned For
Owner Type
Purchase Details
Closed on
Feb 12, 2014
Sold by
Carver Jerry N and Carver Ronda L
Bought by
Jacobs Deanne M
Current Estimated Value
Purchase Details
Closed on
Mar 9, 2011
Sold by
Roman Shannon Kelly and The Estate Of Thomas Patrick B
Bought by
Carver Jerry N and Carver Ronda L
Purchase Details
Closed on
Nov 18, 2008
Sold by
Mortgage Electronic Registration Systems
Bought by
Federal National Mortgage Association
Purchase Details
Closed on
Nov 14, 2008
Sold by
Crozier John and Crozier Mary
Bought by
Mortgage Electronic Registration Systems
Purchase Details
Closed on
Aug 31, 2006
Sold by
Halushka Stephen D and Halushka Michele
Bought by
Crozier John M and Crozier Mary
Purchase Details
Closed on
Aug 5, 1998
Sold by
Hunt Kevin
Bought by
Halushka Michele
Create a Home Valuation Report for This Property
The Home Valuation Report is an in-depth analysis detailing your home's value as well as a comparison with similar homes in the area
Home Values in the Area
Average Home Value in this Area
Purchase History
| Date | Buyer | Sale Price | Title Company |
|---|---|---|---|
| Jacobs Deanne M | -- | None Available | |
| Carver Jerry N | $28,000 | Attorneys Title Agency Llc | |
| Federal National Mortgage Association | -- | None Available | |
| Mortgage Electronic Registration Systems | $77,901 | None Available | |
| Crozier John M | $94,000 | Colonial Title Company | |
| Halushka Michele | $62,900 | -- |
Source: Public Records
Tax History Compared to Growth
Tax History
| Year | Tax Paid | Tax Assessment Tax Assessment Total Assessment is a certain percentage of the fair market value that is determined by local assessors to be the total taxable value of land and additions on the property. | Land | Improvement |
|---|---|---|---|---|
| 2025 | $1,835 | $65,600 | $0 | $0 |
| 2024 | $974 | $60,400 | $0 | $0 |
| 2023 | $934 | $53,800 | $0 | $0 |
| 2022 | $1,639 | $48,400 | $0 | $0 |
| 2021 | $1,592 | $41,600 | $0 | $0 |
| 2020 | $908 | $36,500 | $0 | $0 |
| 2019 | $1,396 | $32,900 | $0 | $0 |
| 2018 | $1,370 | $0 | $0 | $0 |
| 2017 | $1,278 | $26,165 | $6,081 | $20,084 |
| 2016 | $1,271 | $26,165 | $0 | $0 |
| 2015 | $828 | $24,905 | $0 | $0 |
| 2013 | -- | $24,748 | $0 | $0 |
| 2011 | -- | $31,590 | $0 | $0 |
Source: Public Records
Map
Nearby Homes
- 26211 Clancy St
- 26354 Dale Ct
- 26204 Belanger St
- 26291 Compson St
- 26070 Bryan St
- 15676 Frazho Rd
- 26371 Compson St
- 15329 Petrie St
- 15738 Frazho Rd
- 26140 Nagel St
- 15214 Petrie St
- 15010 Petrie St
- 26700 Belanger St
- 15251 Wildwood St
- 26621 Kathy St
- 26584 Kathy St
- 15238 Troy St
- 26342 Grandmont St
- 25280 Dale St
- 26750 Belanger St
- 15426 Hill Ct
- 15406 Hill Ct
- 15436 Hill Ct
- 15396 Hill Ct
- 26051 Lehner St
- 15421 Frazho Rd
- 15395 Frazho Rd
- 26200 Dale Ct
- 15431 Frazho Rd
- 15431 Hill Ct
- 15375 Frazho Rd
- 15371 Frazho Rd
- 15350 Hill Ct
- 26071 Lehner St
- 26206 Dale Ct
- 15340 Hill Ct
- 26201 Lehner St
- 26052 Lehner St
- 26060 Lehner St
- 26048 Lehner St