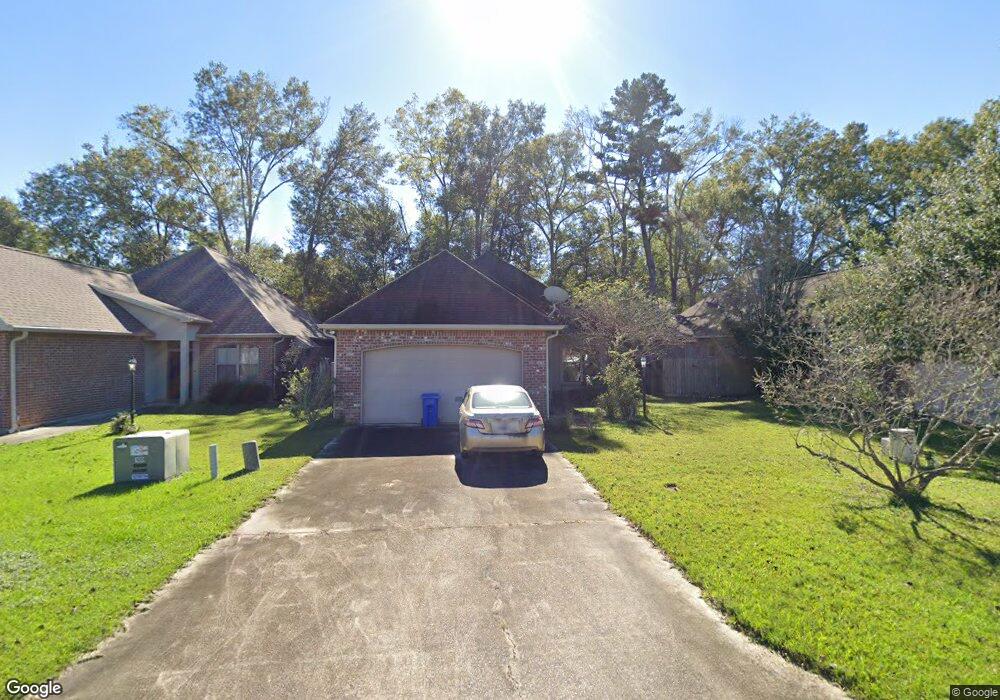
1542 Camellia Dr Hammond, LA 70403
Estimated Value: $236,843 - $258,000
3
Beds
2
Baths
1,600
Sq Ft
$153/Sq Ft
Est. Value
About This Home
This home is located at 1542 Camellia Dr, Hammond, LA 70403 and is currently estimated at $244,711, approximately $152 per square foot. 1542 Camellia Dr is a home located in Tangipahoa Parish with nearby schools including Hammond Eastside Magnet, Hammond High Magnet School, and Tangi Academy.
Ownership History
Date
Name
Owned For
Owner Type
Purchase Details
Closed on
Dec 18, 2014
Sold by
Schilling Harmon L and Schilling Kathy M
Bought by
Lucas Deanna M
Current Estimated Value
Home Financials for this Owner
Home Financials are based on the most recent Mortgage that was taken out on this home.
Original Mortgage
$20,000
Interest Rate
7%
Mortgage Type
New Conventional
Purchase Details
Closed on
Dec 20, 2013
Sold by
Lucas Deanna M
Bought by
Schilling Harmon
Purchase Details
Closed on
Oct 8, 2013
Sold by
Lucas Deanna M
Bought by
Schilling Harmon
Purchase Details
Closed on
Feb 12, 2009
Sold by
Scott Sandage Properties & Construction
Bought by
Lucas Deanna M
Home Financials for this Owner
Home Financials are based on the most recent Mortgage that was taken out on this home.
Original Mortgage
$125,000
Interest Rate
5.06%
Mortgage Type
Future Advance Clause Open End Mortgage
Create a Home Valuation Report for This Property
The Home Valuation Report is an in-depth analysis detailing your home's value as well as a comparison with similar homes in the area
Home Values in the Area
Average Home Value in this Area
Purchase History
| Date | Buyer | Sale Price | Title Company |
|---|---|---|---|
| Lucas Deanna M | $165,000 | None Available | |
| Schilling Harmon | $139,000 | None Available | |
| Schilling Harmon | $139,000 | None Available | |
| Lucas Deanna M | -- | None Available |
Source: Public Records
Mortgage History
| Date | Status | Borrower | Loan Amount |
|---|---|---|---|
| Closed | Lucas Deanna M | $20,000 | |
| Previous Owner | Lucas Deanna M | $125,000 |
Source: Public Records
Tax History Compared to Growth
Tax History
| Year | Tax Paid | Tax Assessment Tax Assessment Total Assessment is a certain percentage of the fair market value that is determined by local assessors to be the total taxable value of land and additions on the property. | Land | Improvement |
|---|---|---|---|---|
| 2024 | $1,326 | $16,021 | $3,780 | $12,241 |
| 2023 | $1,326 | $15,865 | $3,500 | $12,365 |
| 2022 | $1,326 | $15,865 | $3,500 | $12,365 |
| 2021 | $1,039 | $15,865 | $3,500 | $12,365 |
| 2020 | $1,659 | $15,865 | $3,500 | $12,365 |
| 2019 | $1,655 | $15,865 | $3,500 | $12,365 |
| 2018 | $1,660 | $15,865 | $3,500 | $12,365 |
| 2017 | $1,660 | $15,865 | $3,500 | $12,365 |
| 2016 | $1,660 | $15,865 | $3,500 | $12,365 |
| 2015 | $711 | $15,990 | $3,500 | $12,490 |
| 2014 | $1,473 | $18,475 | $3,500 | $14,975 |
Source: Public Records
Map
Nearby Homes
- 17142 Parker Ln
- 43315 S Range Rd
- 44018 Easy St
- 43242 Creek Cir Unit 203
- 16195 E Minnesota Park Rd
- 43225 Creek Circle Unit #604 None
- 43225 Creek Circle Unit #605 None
- 43225 Creek Circle Unit #603 None
- 43225 Creek Circle Unit #606 None
- 43225 Creek Cir
- 1305 S Holly St
- 43232 S Range Rd
- 17198 Bridle Path None
- 17198 Bridle Path
- 43448 Springwood Way
- 43484 Springwood Way
- 44083 High Oats Trail
- 901 S Chestnut St
- 813 S Olive St
- 1544 Camellia Dr
- 1540 Camellia Dr
- 1546 Camellia Dr
- 1529 Camellia Dr
- 1538 Camellia Dr
- 1548 Camellia Dr
- 43393 S Range Rd
- 1530 Camellia Dr
- 1527 Camellia Dr
- 1547 Camellia Dr
- 1528 Camellia Dr
- 1525 Camellia Dr
- 1549 Camellia Dr
- 1526 Camellia Dr
- 1524 Camellia Dr
- 1523 Camellia Dr
- 1409 S Elm St
- 43371 S Range Rd
- 1503 Camellia Dr
- 1522 Camellia Dr