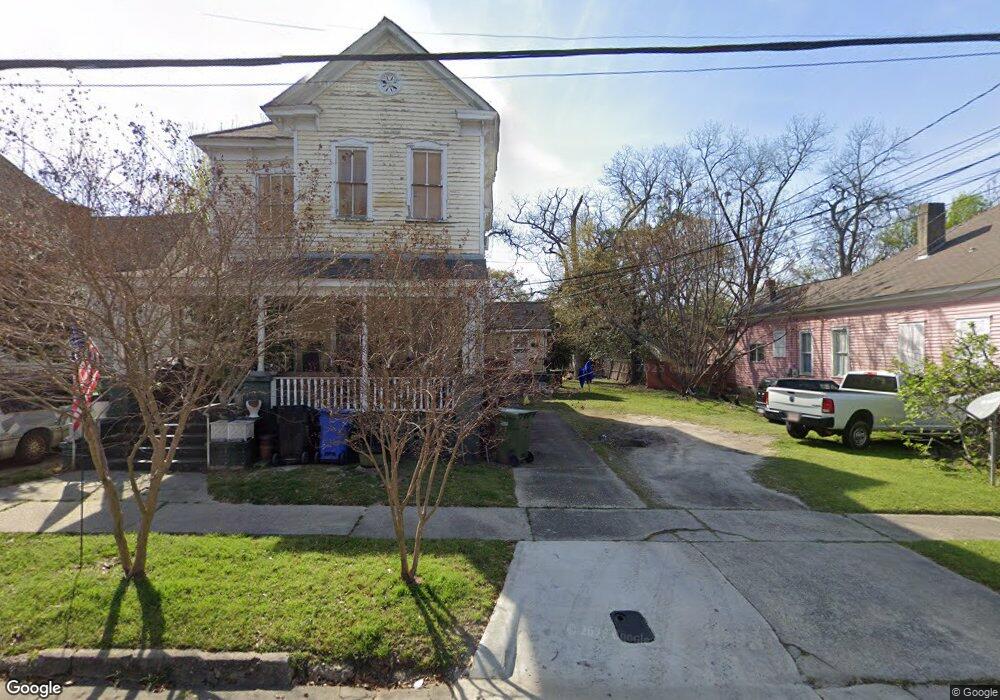
1543 12th Ave Columbus, GA 31901
East Highlands NeighborhoodEstimated Value: $139,000 - $272,411
4
Beds
4
Baths
2,696
Sq Ft
$70/Sq Ft
Est. Value
About This Home
This home is located at 1543 12th Ave, Columbus, GA 31901 and is currently estimated at $187,603, approximately $69 per square foot. 1543 12th Ave is a home located in Muscogee County with nearby schools including Double Churches Middle School, Jordan Vocational High School, and Wynnton Elementary School.
Ownership History
Date
Name
Owned For
Owner Type
Purchase Details
Closed on
May 24, 2012
Sold by
Branch Banking & Trust C
Bought by
Westmoreland Companies Llc
Current Estimated Value
Purchase Details
Closed on
Mar 1, 2011
Sold by
Cofield Investments Llc
Bought by
Branch Banking & Trust Company
Purchase Details
Closed on
Jun 20, 2008
Sold by
Meeks Randy Scott
Bought by
Cofield Investments Llc
Home Financials for this Owner
Home Financials are based on the most recent Mortgage that was taken out on this home.
Original Mortgage
$73,500
Interest Rate
5.97%
Mortgage Type
Commercial
Purchase Details
Closed on
Nov 26, 2007
Sold by
Bibb Rentals Llc
Bought by
Meeks Randy Scott
Home Financials for this Owner
Home Financials are based on the most recent Mortgage that was taken out on this home.
Original Mortgage
$72,500
Interest Rate
6.29%
Mortgage Type
Seller Take Back
Create a Home Valuation Report for This Property
The Home Valuation Report is an in-depth analysis detailing your home's value as well as a comparison with similar homes in the area
Home Values in the Area
Average Home Value in this Area
Purchase History
| Date | Buyer | Sale Price | Title Company |
|---|---|---|---|
| Westmoreland Companies Llc | $35,000 | -- | |
| Branch Banking & Trust Company | $75,000 | None Available | |
| Branch Banking & Trust | $75,000 | -- | |
| Cofield Investments Llc | -- | None Available | |
| Meeks Randy Scott | $77,500 | None Available |
Source: Public Records
Mortgage History
| Date | Status | Borrower | Loan Amount |
|---|---|---|---|
| Previous Owner | Cofield Investments Llc | $73,500 | |
| Previous Owner | Meeks Randy Scott | $72,500 |
Source: Public Records
Tax History Compared to Growth
Tax History
| Year | Tax Paid | Tax Assessment Tax Assessment Total Assessment is a certain percentage of the fair market value that is determined by local assessors to be the total taxable value of land and additions on the property. | Land | Improvement |
|---|---|---|---|---|
| 2025 | $1,409 | $69,736 | $8,092 | $61,644 |
| 2024 | $1,409 | $36,000 | $8,092 | $27,908 |
| 2023 | $851 | $36,000 | $8,092 | $27,908 |
| 2022 | $1,458 | $42,000 | $8,092 | $33,908 |
| 2021 | $1,633 | $47,048 | $8,092 | $38,956 |
| 2020 | $1,921 | $47,048 | $8,092 | $38,956 |
| 2019 | $911 | $22,240 | $4,044 | $18,196 |
| 2018 | $911 | $22,240 | $4,044 | $18,196 |
| 2017 | $914 | $22,240 | $4,044 | $18,196 |
| 2016 | $660 | $16,000 | $3,400 | $12,600 |
| 2015 | $661 | $16,000 | $3,400 | $12,600 |
| 2014 | $662 | $16,000 | $0 | $0 |
| 2013 | -- | $16,000 | $0 | $0 |
Source: Public Records
Map
Nearby Homes