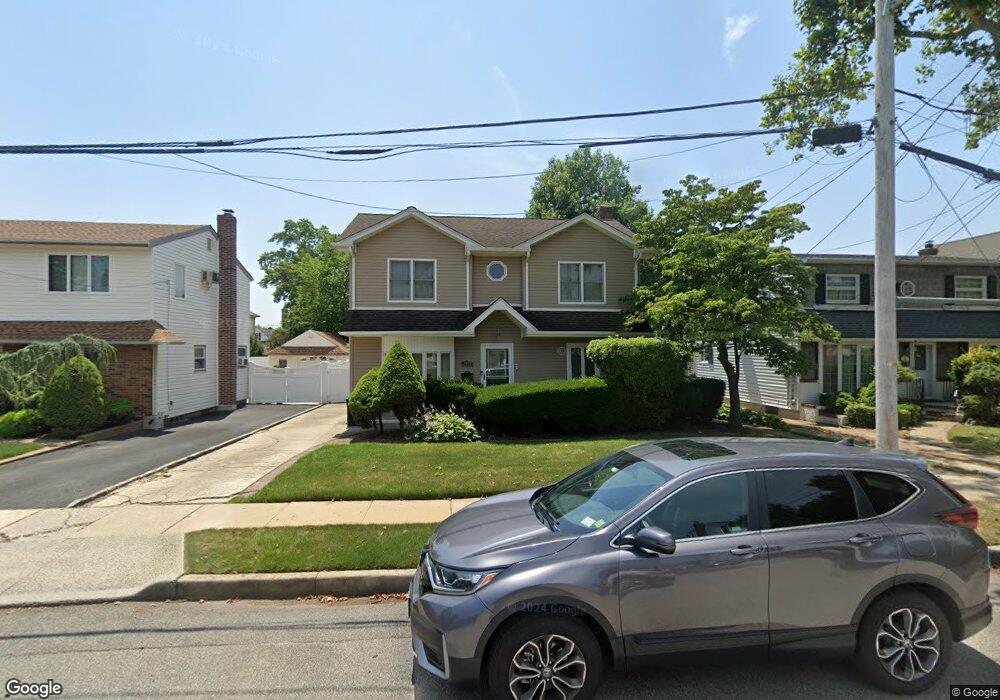
1543 Clay St Elmont, NY 11003
Estimated Value: $769,000 - $792,355
4
Beds
2
Baths
1,464
Sq Ft
$533/Sq Ft
Est. Value
About This Home
This home is located at 1543 Clay St, Elmont, NY 11003 and is currently estimated at $780,678, approximately $533 per square foot. 1543 Clay St is a home located in Nassau County with nearby schools including Our Lady Of Victory School.
Ownership History
Date
Name
Owned For
Owner Type
Purchase Details
Closed on
Jun 16, 2020
Sold by
Smith Marlon G and Smith Kim K
Bought by
Smith Marlon G
Current Estimated Value
Purchase Details
Closed on
Aug 9, 2004
Sold by
Smith Marlon
Purchase Details
Closed on
Oct 4, 2002
Sold by
Toscano Thomas
Bought by
Smith Marlon
Purchase Details
Closed on
Feb 29, 1996
Sold by
Empire State Properties Inc
Bought by
Toscano Thomas and Toscano Caroline
Home Financials for this Owner
Home Financials are based on the most recent Mortgage that was taken out on this home.
Original Mortgage
$107,000
Interest Rate
7%
Purchase Details
Closed on
Aug 17, 1995
Sold by
Levine Saul Ref
Bought by
Empire State Properties Inc
Create a Home Valuation Report for This Property
The Home Valuation Report is an in-depth analysis detailing your home's value as well as a comparison with similar homes in the area
Home Values in the Area
Average Home Value in this Area
Purchase History
| Date | Buyer | Sale Price | Title Company |
|---|---|---|---|
| Smith Marlon G | $75,000 | None Available | |
| -- | -- | -- | |
| Smith Marlon | $305,000 | -- | |
| Toscano Thomas | $172,870 | -- | |
| Empire State Properties Inc | $106,900 | -- |
Source: Public Records
Mortgage History
| Date | Status | Borrower | Loan Amount |
|---|---|---|---|
| Previous Owner | Toscano Thomas | $107,000 |
Source: Public Records
Tax History Compared to Growth
Tax History
| Year | Tax Paid | Tax Assessment Tax Assessment Total Assessment is a certain percentage of the fair market value that is determined by local assessors to be the total taxable value of land and additions on the property. | Land | Improvement |
|---|---|---|---|---|
| 2025 | $15,376 | $643 | $288 | $355 |
| 2024 | $4,874 | $643 | $288 | $355 |
| 2023 | $13,627 | $643 | $288 | $355 |
| 2022 | $13,627 | $643 | $288 | $355 |
| 2021 | $13,081 | $614 | $275 | $339 |
| 2020 | $5,990 | $770 | $630 | $140 |
| 2019 | $11,887 | $825 | $535 | $290 |
| 2018 | $10,945 | $1,041 | $0 | $0 |
| 2017 | $8,316 | $1,041 | $675 | $366 |
| 2016 | $12,980 | $1,041 | $675 | $366 |
| 2015 | $4,307 | $1,041 | $675 | $366 |
| 2014 | $4,307 | $1,041 | $675 | $366 |
| 2013 | $4,037 | $1,041 | $675 | $366 |
Source: Public Records
Map
Nearby Homes