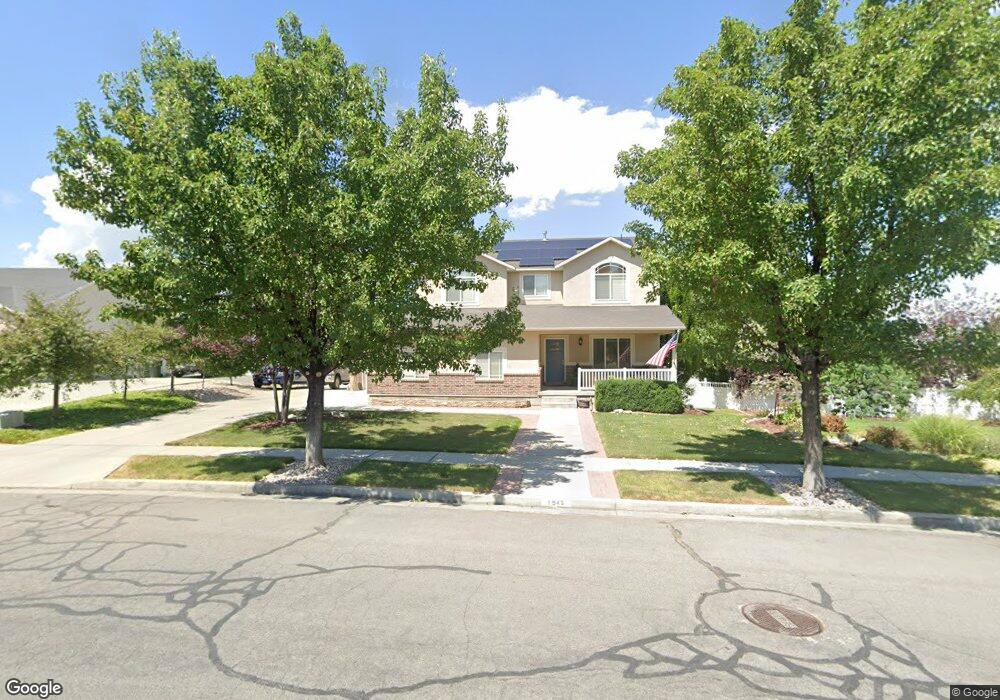
1543 Drysdale Way Tooele, UT 84074
Estimated Value: $491,000 - $603,000
--
Bed
--
Bath
3,171
Sq Ft
$170/Sq Ft
Est. Value
About This Home
This home is located at 1543 Drysdale Way, Tooele, UT 84074 and is currently estimated at $538,712, approximately $169 per square foot. 1543 Drysdale Way is a home located in Tooele County with nearby schools including Overlake Elementary School, Clarke N. Johnsen Junior High School, and Stansbury High School.
Ownership History
Date
Name
Owned For
Owner Type
Purchase Details
Closed on
Jan 24, 2006
Sold by
Olson Christopher and Kalmar David
Bought by
Olson Chris and Olson Rachel L
Current Estimated Value
Home Financials for this Owner
Home Financials are based on the most recent Mortgage that was taken out on this home.
Original Mortgage
$197,701
Outstanding Balance
$110,662
Interest Rate
6.2%
Mortgage Type
FHA
Estimated Equity
$428,050
Purchase Details
Closed on
Aug 4, 2005
Sold by
Olsen Christopher
Bought by
Olson Christopher and Kalmar David
Purchase Details
Closed on
Mar 17, 2005
Sold by
Kenney Randy and Kenney Daphne
Bought by
Olson Christopher
Home Financials for this Owner
Home Financials are based on the most recent Mortgage that was taken out on this home.
Original Mortgage
$29,295
Interest Rate
5.61%
Mortgage Type
Stand Alone Second
Create a Home Valuation Report for This Property
The Home Valuation Report is an in-depth analysis detailing your home's value as well as a comparison with similar homes in the area
Home Values in the Area
Average Home Value in this Area
Purchase History
| Date | Buyer | Sale Price | Title Company |
|---|---|---|---|
| Olson Chris | -- | First Ameican Title Ins | |
| Olson Christopher | -- | First American Title Ins Inc | |
| Olson Christopher | -- | First American Title Ins Inc |
Source: Public Records
Mortgage History
| Date | Status | Borrower | Loan Amount |
|---|---|---|---|
| Open | Olson Chris | $197,701 | |
| Previous Owner | Olson Christopher | $29,295 |
Source: Public Records
Tax History Compared to Growth
Tax History
| Year | Tax Paid | Tax Assessment Tax Assessment Total Assessment is a certain percentage of the fair market value that is determined by local assessors to be the total taxable value of land and additions on the property. | Land | Improvement |
|---|---|---|---|---|
| 2025 | $3,808 | $558,026 | $132,500 | $425,526 |
| 2024 | $3,837 | $283,712 | $72,875 | $210,837 |
| 2023 | $3,837 | $311,336 | $69,365 | $241,971 |
| 2022 | $4,149 | $342,820 | $79,695 | $263,125 |
| 2021 | $3,306 | $227,102 | $28,806 | $198,296 |
| 2020 | $3,094 | $374,285 | $52,375 | $321,910 |
| 2019 | $2,997 | $358,956 | $52,375 | $306,581 |
| 2018 | $2,587 | $294,814 | $35,000 | $259,814 |
| 2017 | $2,061 | $277,817 | $35,000 | $242,817 |
| 2016 | $1,834 | $136,929 | $13,750 | $123,179 |
| 2015 | $1,834 | $130,104 | $0 | $0 |
| 2014 | -- | $130,104 | $0 | $0 |
Source: Public Records
Map
Nearby Homes
- 1557 Colavito Way
- 295 Drysdale Way
- 422 W 1360 N
- 1558 Durocher Ln
- 522 W 1470 N
- 552 W 1410 N
- 578 W 1470 N Unit 22
- 168 W 1320 N Unit 171
- 183 W 1320 N Unit 169
- 183 W 1320 N
- 132 W Ebbets Unit 255
- 118 W High Cheddar
- 1444 N Berra Blvd Unit 231
- 1444 N Berra Blvd
- 1456 N Berra Blvd
- 124 Ebbets Field
- 1403 N Baen Way
- 1403 N Baen Way Unit 233
- 1466 N Berra Blvd Unit 227
- 1413 N Baen Way Unit 230
- 1589 Colavito Way
- 1581 Colavito Way
- 1593 Colavito Way
- 331 Candellaria Dr
- 1531 Drysdale Way
- 1601 Colavito Way
- 1548 Drysdale Way
- 1517 Drysdale Way
- 1532 Drysdale Way
- 1563 Colavito Way
- 1516 Drysdale Way
- 1558 Colavito Way Unit 265
- 1613 Colavito Way
- 1590 Colavito Way
- 1582 Colavito Way
- 1594 Colavito Way
- 1594 Colavito Way Unit 269
- 1614 Colavito Way
- 1614 Colavito Way Unit 270
- 1502 N Clemente Way