Estimated Value: $226,000 - $284,000
3
Beds
1
Bath
1,080
Sq Ft
$230/Sq Ft
Est. Value
About This Home
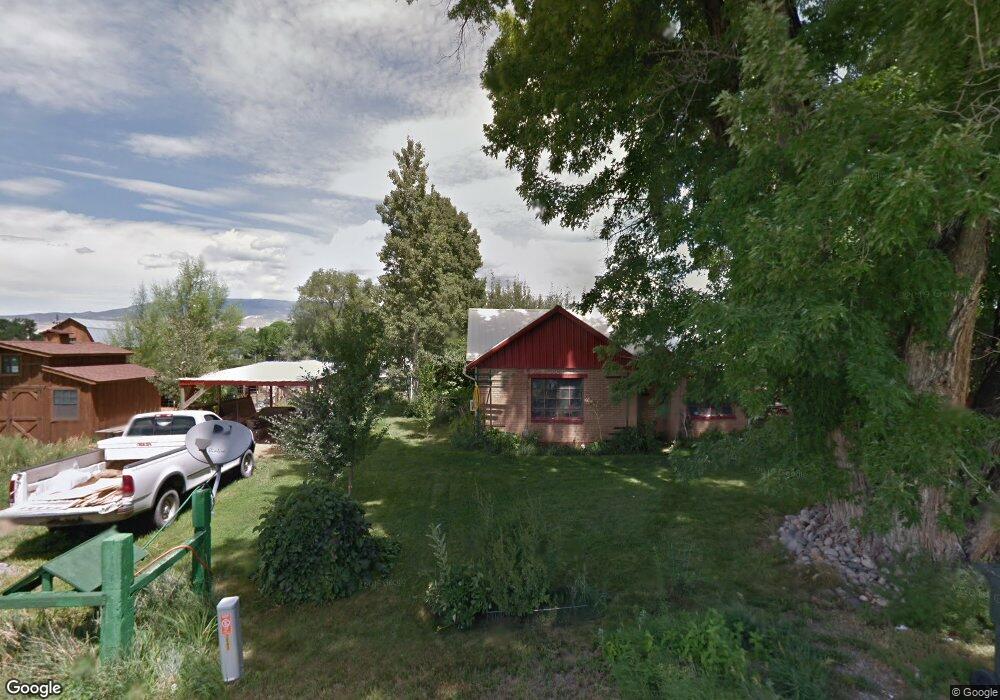
This home is located at 1543 H20 Rd, Delta, CO 81416 and is currently estimated at $248,357, approximately $229 per square foot. 1543 H20 Rd is a home located in Delta County with nearby schools including Garnet Mesa Elementary School, Lincoln Elementary School, and Delta Middle School.
Ownership History
Date
Name
Owned For
Owner Type
Purchase Details
Closed on
Oct 9, 2018
Sold by
Kerch Stephen L
Bought by
Kerch Stephen L and Kerch Diana P
Current Estimated Value
Purchase Details
Closed on
Jul 13, 2018
Sold by
Driskill Rick L and Driskill Dawna Lee Y
Bought by
Kerch Stephen L
Home Financials for this Owner
Home Financials are based on the most recent Mortgage that was taken out on this home.
Original Mortgage
$60,000
Outstanding Balance
$51,999
Interest Rate
4.5%
Mortgage Type
New Conventional
Estimated Equity
$196,358
Purchase Details
Closed on
Apr 4, 2008
Sold by
Driskiu Rick L
Bought by
Driskiu Rick L and Driskiu Dawna Lee Y
Purchase Details
Closed on
Sep 11, 2006
Sold by
Timberlake Fred L
Bought by
Driskill Rick L
Home Financials for this Owner
Home Financials are based on the most recent Mortgage that was taken out on this home.
Original Mortgage
$95,400
Interest Rate
6.51%
Mortgage Type
New Conventional
Create a Home Valuation Report for This Property
The Home Valuation Report is an in-depth analysis detailing your home's value as well as a comparison with similar homes in the area
Home Values in the Area
Average Home Value in this Area
Purchase History
| Date | Buyer | Sale Price | Title Company |
|---|---|---|---|
| Kerch Stephen L | -- | None Available | |
| Kerch Stephen L | $115,000 | Land Title Guarantee Co | |
| Driskiu Rick L | -- | None Available | |
| Driskill Rick L | $106,000 | None Available |
Source: Public Records
Mortgage History
| Date | Status | Borrower | Loan Amount |
|---|---|---|---|
| Open | Kerch Stephen L | $60,000 | |
| Previous Owner | Driskill Rick L | $95,400 |
Source: Public Records
Tax History Compared to Growth
Tax History
| Year | Tax Paid | Tax Assessment Tax Assessment Total Assessment is a certain percentage of the fair market value that is determined by local assessors to be the total taxable value of land and additions on the property. | Land | Improvement |
|---|---|---|---|---|
| 2024 | $628 | $9,491 | $3,330 | $6,161 |
| 2023 | $628 | $9,491 | $3,330 | $6,161 |
| 2022 | $567 | $8,780 | $3,128 | $5,652 |
| 2021 | $572 | $9,032 | $3,218 | $5,814 |
| 2020 | $506 | $7,877 | $2,860 | $5,017 |
| 2019 | $501 | $7,877 | $2,860 | $5,017 |
| 2018 | $462 | $6,996 | $2,016 | $4,980 |
| 2017 | $448 | $6,996 | $2,016 | $4,980 |
| 2016 | $383 | $6,543 | $2,229 | $4,314 |
| 2014 | -- | $6,406 | $2,428 | $3,978 |
Source: Public Records
Map
Nearby Homes
- 1570 G86 Ln
- 760 1575 Rd
- 676 Highway 50 Unit Space 43
- TBD 1500 Ct
- 167 Gunnison River Dr
- 1475 and Tbd Highway 50
- 1491 Highway 50 Unit 64
- 10.5 ac. LOT 1B 1525 Rd
- 1511 Yankee Girl St
- 15101 Silver Belle St
- 15143 Silver Belle St
- 15179 Silver Belle St
- 311 W 3rd St
- 184 Garnet Ave
- 337 & 341 Palmer St
- 211 W 4th St
- 833 and 835 Garnet Ave
- 308 E 4th St
- 65 Circle Dr
- 320 Grand Blvd