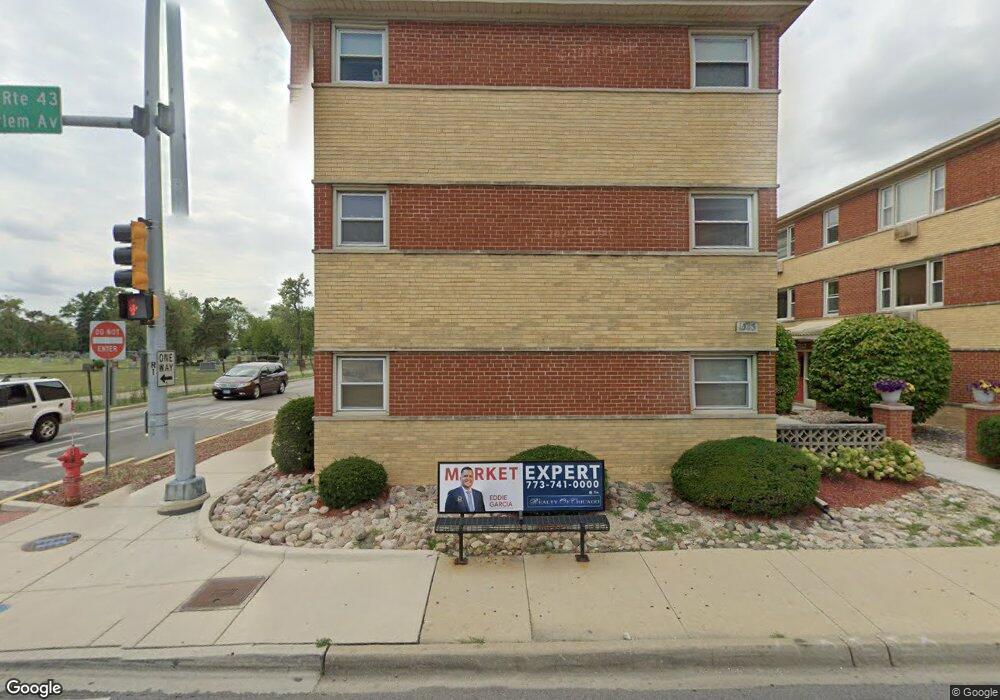
1543 Harlem Ave Unit 15433E Forest Park, IL 60130
Estimated Value: $131,000 - $183,000
2
Beds
1
Bath
1,000
Sq Ft
$164/Sq Ft
Est. Value
About This Home
This home is located at 1543 Harlem Ave Unit 15433E, Forest Park, IL 60130 and is currently estimated at $164,273, approximately $164 per square foot. 1543 Harlem Ave Unit 15433E is a home located in Cook County with nearby schools including Garfield Elementary School, Betsy Ross Elementary School, and Field Stevenson Elementary School.
Ownership History
Date
Name
Owned For
Owner Type
Purchase Details
Closed on
Dec 18, 2019
Sold by
Imam Syed and Imam Fariha
Bought by
Cuevas Roberto
Current Estimated Value
Home Financials for this Owner
Home Financials are based on the most recent Mortgage that was taken out on this home.
Original Mortgage
$101,650
Interest Rate
3.74%
Mortgage Type
New Conventional
Purchase Details
Closed on
Sep 19, 2003
Sold by
Holloway Troy
Bought by
Siddiqui Fariha
Home Financials for this Owner
Home Financials are based on the most recent Mortgage that was taken out on this home.
Original Mortgage
$14,700
Interest Rate
6.49%
Mortgage Type
Credit Line Revolving
Purchase Details
Closed on
Mar 30, 1998
Sold by
Caslavsky Peter and Caslavsky Jaroslava
Bought by
Holloway Troy
Home Financials for this Owner
Home Financials are based on the most recent Mortgage that was taken out on this home.
Original Mortgage
$64,500
Interest Rate
7.19%
Mortgage Type
FHA
Create a Home Valuation Report for This Property
The Home Valuation Report is an in-depth analysis detailing your home's value as well as a comparison with similar homes in the area
Home Values in the Area
Average Home Value in this Area
Purchase History
| Date | Buyer | Sale Price | Title Company |
|---|---|---|---|
| Cuevas Roberto | $107,000 | Chicago Title | |
| Siddiqui Fariha | $98,000 | Pntn | |
| Holloway Troy | $66,000 | -- |
Source: Public Records
Mortgage History
| Date | Status | Borrower | Loan Amount |
|---|---|---|---|
| Previous Owner | Cuevas Roberto | $101,650 | |
| Previous Owner | Siddiqui Fariha | $14,700 | |
| Previous Owner | Holloway Troy | $64,500 | |
| Closed | Siddiqui Fariha | $73,500 |
Source: Public Records
Tax History Compared to Growth
Tax History
| Year | Tax Paid | Tax Assessment Tax Assessment Total Assessment is a certain percentage of the fair market value that is determined by local assessors to be the total taxable value of land and additions on the property. | Land | Improvement |
|---|---|---|---|---|
| 2024 | $3,215 | $10,705 | $579 | $10,126 |
| 2023 | $2,753 | $10,705 | $579 | $10,126 |
| 2022 | $2,753 | $7,682 | $868 | $6,814 |
| 2021 | $2,615 | $7,682 | $868 | $6,814 |
| 2020 | $1,519 | $7,682 | $868 | $6,814 |
| 2019 | $742 | $5,536 | $791 | $4,745 |
| 2018 | $724 | $5,536 | $791 | $4,745 |
| 2017 | $729 | $5,536 | $791 | $4,745 |
| 2016 | $1,491 | $6,658 | $713 | $5,945 |
| 2015 | $2,317 | $9,191 | $713 | $8,478 |
| 2014 | $3,204 | $11,825 | $713 | $11,112 |
| 2013 | $1,944 | $8,640 | $713 | $7,927 |
Source: Public Records
Map
Nearby Homes
- 1617 Maple Ave
- 1409 Harlem Ave
- 1821 S Harlem Ave
- 1434 Circle Ave
- 1618 Wenonah Ave
- 1531 Wenonah Ave
- 1327 Harlem Ave
- 1329 Wisconsin Ave
- 1547 Clinton Ave
- 1835 Home Ave
- 1227 S Harlem Ave Unit 512
- 1227 S Harlem Ave Unit 208
- 1227 S Harlem Ave Unit 307
- 1227 S Harlem Ave Unit 514
- 1227 S Harlem Ave Unit 510
- 1227 S Harlem Ave Unit 415
- 1224 Elgin Ave
- 1223 Elgin Ave Unit G1
- 1648 Kenilworth Ave
- 1225 Marengo Ave
- 1541 Harlem Ave Unit 15412N
- 1541 Harlem Ave Unit 15413S
- 1541 Harlem Ave Unit 15412S
- 1541 Harlem Ave Unit 15411N
- 1541 Harlem Ave Unit 15411S
- 1541 Harlem Ave Unit 3N
- 1543 Harlem Ave Unit 15432W
- 1543 Harlem Ave Unit 15331W
- 1543 Harlem Ave Unit 15431W
- 1543 Harlem Ave Unit 15432E
- 1543 Harlem Ave Unit 15413N
- 1543 Harlem Ave Unit 15433W
- 1543 Harlem Ave Unit 15431E
- 1543 Harlem Ave Unit 3W
- 1543 Harlem Ave Unit 1W
- 1543 Harlem Ave Unit 2W
- 1543 Harlem Ave Unit 3E
- 1535 Harlem Ave Unit 2S
- 1535 Harlem Ave Unit 15353N
- 1535 Harlem Ave Unit 15352N