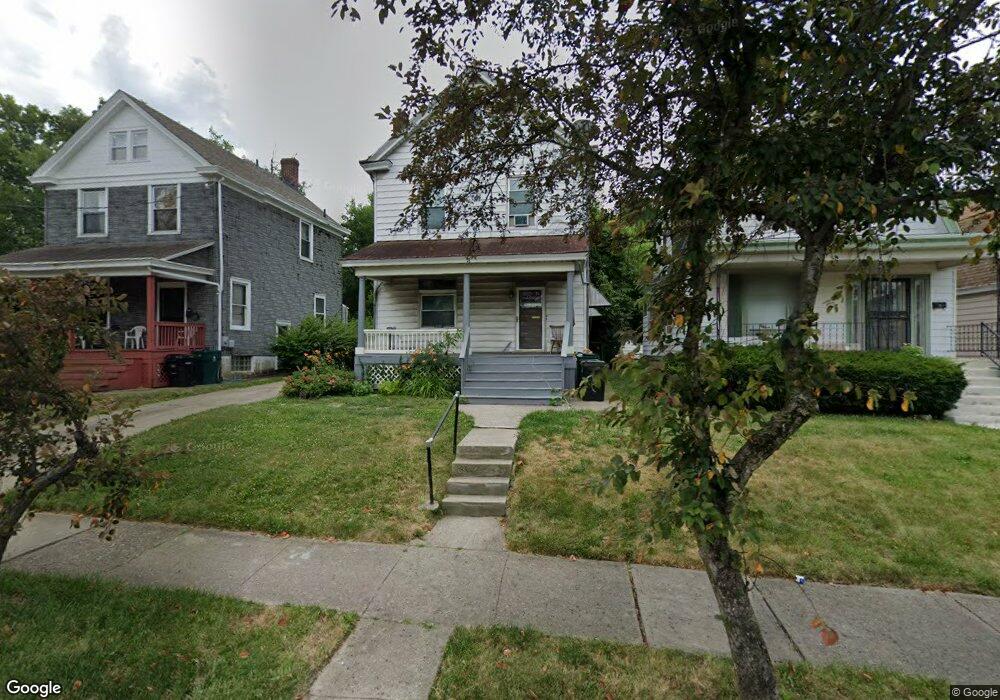
1543 Jonathan Ave Cincinnati, OH 45207
Evanston NeighborhoodEstimated Value: $120,000 - $222,000
2
Beds
1
Bath
1,536
Sq Ft
$110/Sq Ft
Est. Value
About This Home
This home is located at 1543 Jonathan Ave, Cincinnati, OH 45207 and is currently estimated at $168,405, approximately $109 per square foot. 1543 Jonathan Ave is a home located in Hamilton County with nearby schools including Evanston Academy Elementary School, Clark Montessori High School, and Shroder High School.
Ownership History
Date
Name
Owned For
Owner Type
Purchase Details
Closed on
Sep 30, 2015
Sold by
Weber Dale and Weber Mary
Bought by
Weber Family Farms Llc
Current Estimated Value
Purchase Details
Closed on
Aug 8, 2006
Sold by
The Bank Of New York
Bought by
Blakney Ebonie M
Home Financials for this Owner
Home Financials are based on the most recent Mortgage that was taken out on this home.
Original Mortgage
$27,000
Interest Rate
10.62%
Mortgage Type
Purchase Money Mortgage
Purchase Details
Closed on
Jun 7, 2006
Sold by
Griffin Gregory B and Griffin Rosalind V
Bought by
The Bank Of New York and Holders Of The Eqcc Asset Backed Certifi
Purchase Details
Closed on
Aug 31, 1995
Sold by
Sitton Marshall and Davis Eliza
Bought by
Griffin Gregory B and Griffin Rosalind
Home Financials for this Owner
Home Financials are based on the most recent Mortgage that was taken out on this home.
Original Mortgage
$16,000
Interest Rate
7.76%
Create a Home Valuation Report for This Property
The Home Valuation Report is an in-depth analysis detailing your home's value as well as a comparison with similar homes in the area
Home Values in the Area
Average Home Value in this Area
Purchase History
| Date | Buyer | Sale Price | Title Company |
|---|---|---|---|
| Weber Family Farms Llc | -- | Attorney | |
| Blakney Ebonie M | $30,000 | Attorney | |
| The Bank Of New York | $54,000 | None Available | |
| Griffin Gregory B | $43,500 | -- |
Source: Public Records
Mortgage History
| Date | Status | Borrower | Loan Amount |
|---|---|---|---|
| Previous Owner | Blakney Ebonie M | $27,000 | |
| Previous Owner | Griffin Gregory B | $16,000 |
Source: Public Records
Tax History
| Year | Tax Paid | Tax Assessment Tax Assessment Total Assessment is a certain percentage of the fair market value that is determined by local assessors to be the total taxable value of land and additions on the property. | Land | Improvement |
|---|---|---|---|---|
| 2025 | $2,221 | $34,903 | $7,571 | $27,332 |
| 2024 | $2,218 | $34,903 | $7,571 | $27,332 |
| 2023 | $2,222 | $34,903 | $7,571 | $27,332 |
| 2022 | $1,179 | $16,570 | $6,598 | $9,972 |
| 2021 | $1,155 | $16,570 | $6,598 | $9,972 |
| 2020 | $1,159 | $16,570 | $6,598 | $9,972 |
| 2019 | $1,168 | $15,201 | $6,052 | $9,149 |
| 2018 | $1,169 | $15,201 | $6,052 | $9,149 |
| 2017 | $1,125 | $15,201 | $6,052 | $9,149 |
| 2016 | $1,108 | $14,588 | $6,293 | $8,295 |
| 2015 | $943 | $14,588 | $6,293 | $8,295 |
| 2014 | $950 | $14,588 | $6,293 | $8,295 |
| 2013 | $929 | $14,029 | $6,052 | $7,977 |
Source: Public Records
Map
Nearby Homes
- 3472 Woodburn Ave
- 1627 Jonathan Ave
- 3433 Pleasant View Ave
- 3443 Montgomery Rd
- 1521 Blair Ave
- 1606 Brewster Ave
- 1608 Brewster Ave
- 3556 Woodburn Ave
- 1517 Saint Leger Place
- 3343 Fairfield Ave
- 1739 Holloway Ave
- 3612 Idlewild Ave
- 3615 Newton Ave
- 1527 Dana Ave
- 3342 Fairfield Ave
- 3625 Newton Ave
- 3339 Spokane Ave
- 3315 Fairfield Ave
- 1534 Dixmont Ave
- 3311 Fairfield Ave
- 1547 Jonathan Ave
- 1541 Jonathan Ave
- 3464 Fernside Place
- 1539 Jonathan Ave
- 3462 Fernside Place
- 1537 Jonathan Ave
- 3460 Fernside Place
- 1551 Jonathan Ave
- 3471 Woodburn Ave
- 3473 Woodburn Ave
- 3458 Fernside Place
- 3469 Woodburn Ave
- 3475 Woodburn Ave
- 3465 Woodburn Ave
- 3456 Fernside Place
- 3461 Woodburn Ave
- 3477 Woodburn Ave
- 3452 Fernside Place
- 3461 Fernside Place
- 1534 Jonathan Ave
Your Personal Tour Guide
Ask me questions while you tour the home.