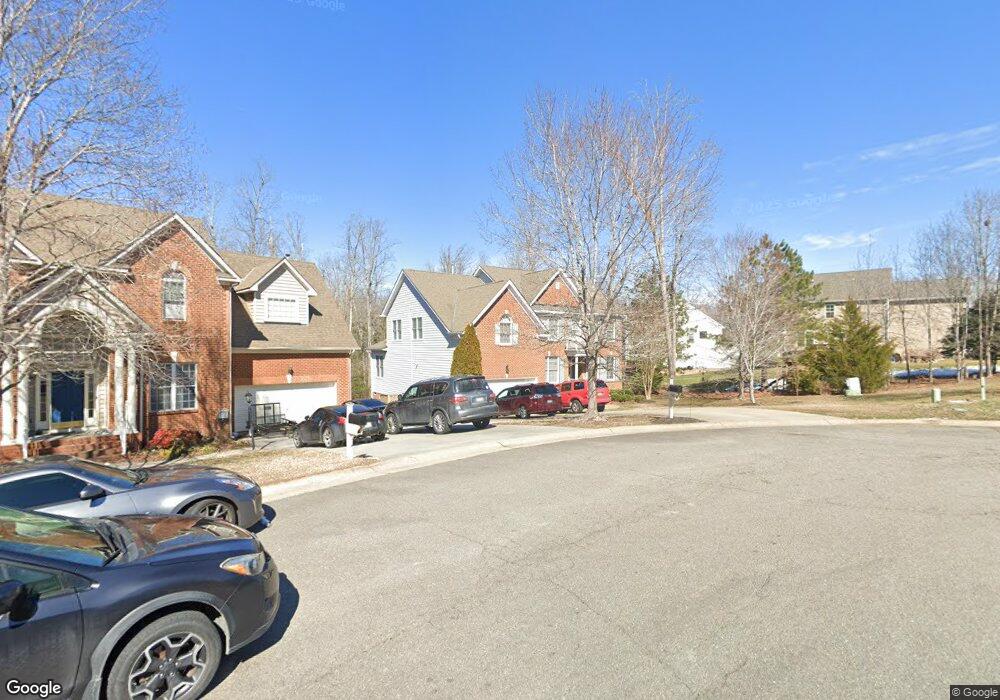
1543 Lundy Terrace Midlothian, VA 23114
Estimated Value: $600,534 - $631,000
5
Beds
3
Baths
3,346
Sq Ft
$185/Sq Ft
Est. Value
About This Home
This home is located at 1543 Lundy Terrace, Midlothian, VA 23114 and is currently estimated at $619,634, approximately $185 per square foot. 1543 Lundy Terrace is a home located in Chesterfield County with nearby schools including Evergreen Elementary, Tomahawk Creek Middle School, and Midlothian High School.
Ownership History
Date
Name
Owned For
Owner Type
Purchase Details
Closed on
Nov 17, 2021
Sold by
The Estate Of Gene Alton Youngblood
Bought by
Youngblood Mary Labeth
Current Estimated Value
Purchase Details
Closed on
Jan 13, 2021
Sold by
Mehri Gholamreza and Khalesi Mahasti
Bought by
Youngblood Gene
Home Financials for this Owner
Home Financials are based on the most recent Mortgage that was taken out on this home.
Original Mortgage
$337,500
Outstanding Balance
$301,220
Interest Rate
2.71%
Mortgage Type
Adjustable Rate Mortgage/ARM
Estimated Equity
$318,414
Purchase Details
Closed on
Mar 14, 2006
Sold by
Parker and Orleans Homebu
Bought by
Menri Gholamreza and Khalessi,Mahasti
Home Financials for this Owner
Home Financials are based on the most recent Mortgage that was taken out on this home.
Original Mortgage
$362,400
Interest Rate
6.27%
Mortgage Type
New Conventional
Purchase Details
Closed on
Jun 2, 2005
Sold by
Hunt B B
Bought by
Parker and Orleans Homebldrs
Create a Home Valuation Report for This Property
The Home Valuation Report is an in-depth analysis detailing your home's value as well as a comparison with similar homes in the area
Home Values in the Area
Average Home Value in this Area
Purchase History
| Date | Buyer | Sale Price | Title Company |
|---|---|---|---|
| Youngblood Mary Labeth | -- | None Available | |
| Youngblood Gene | $375,000 | Homeland Title Stlmnt Agency | |
| Menri Gholamreza | $455,770 | -- | |
| Parker | $303,723 | -- |
Source: Public Records
Mortgage History
| Date | Status | Borrower | Loan Amount |
|---|---|---|---|
| Open | Youngblood Gene | $337,500 | |
| Previous Owner | Menri Gholamreza | $362,400 |
Source: Public Records
Tax History Compared to Growth
Tax History
| Year | Tax Paid | Tax Assessment Tax Assessment Total Assessment is a certain percentage of the fair market value that is determined by local assessors to be the total taxable value of land and additions on the property. | Land | Improvement |
|---|---|---|---|---|
| 2025 | $5,071 | $567,000 | $96,000 | $471,000 |
| 2024 | $5,071 | $536,200 | $96,000 | $440,200 |
| 2023 | $4,606 | $506,200 | $96,000 | $410,200 |
| 2022 | $4,147 | $450,800 | $93,000 | $357,800 |
| 2021 | $3,786 | $395,900 | $91,000 | $304,900 |
| 2020 | $3,786 | $395,900 | $91,000 | $304,900 |
| 2019 | $3,584 | $377,300 | $90,000 | $287,300 |
| 2018 | $3,727 | $395,700 | $90,000 | $305,700 |
| 2017 | $3,670 | $379,700 | $85,000 | $294,700 |
| 2016 | $3,508 | $365,400 | $85,000 | $280,400 |
| 2015 | $3,648 | $378,700 | $85,000 | $293,700 |
| 2014 | $3,601 | $372,500 | $78,000 | $294,500 |
Source: Public Records
Map
Nearby Homes
- 1113 Alcorn Terrace
- 14306 Camack Trail
- 14225 Camack Trail
- 1201 Westwood Village Ln Unit 402
- 1118 Bach Ln
- 1119 Ashton Village Ln
- 14011 Briars Cir Unit 104
- 1066 Arbor Heights Terrace
- 1040 Westwood Village Way Unit 302
- 14000 Briars Cir Unit 304
- 14010 Briars Cir Unit 204
- 1301 Hawkins Wood Cir
- 1042 Arbor Heights Terrace
- 1055 Arbor Heights Terrace
- 1049 Arbor Heights Terrace
- 734 Bristol Village Dr Unit 305
- 734 Bristol Village Dr Unit 208
- 1306 Bach Terrace
- 1043 Arbor Heights Terrace
- 737 Woodland Creek Way
- 1537 Lundy Terrace
- 1131 Agee Terrace
- 1125 Agee Terrace
- 1531 Lundy Terrace
- 1119 Agee Terrace
- 1542 Lundy Terrace
- 1130 Agee Terrace
- 1536 Lundy Terrace
- 1530 Lundy Terrace
- 1113 Agee Terrace
- 1519 Lundy Terrace
- 1524 Lundy Terrace
- 1124 Agee Terrace
- 1107 Agee Terrace
- 1118 Agee Terrace
- 1112 Agee Terrace
- 1518 Lundy Terrace
- 1513 Lundy Terrace
- 14106 Agee Ln
- 14118 Agee Ln