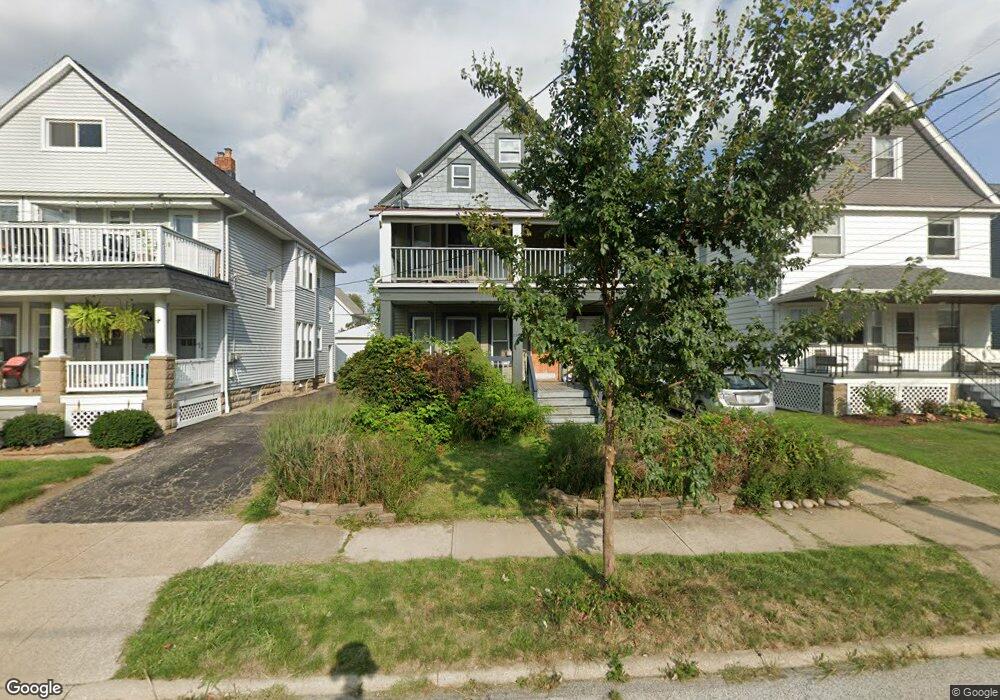
1543 Rosewood Ave Lakewood, OH 44107
Estimated Value: $285,413 - $344,000
4
Beds
1
Bath
1,532
Sq Ft
$201/Sq Ft
Est. Value
About This Home
This home is located at 1543 Rosewood Ave, Lakewood, OH 44107 and is currently estimated at $308,603, approximately $201 per square foot. 1543 Rosewood Ave is a home located in Cuyahoga County with nearby schools including Grant Elementary School, Harding Middle School, and Lakewood High School.
Ownership History
Date
Name
Owned For
Owner Type
Purchase Details
Closed on
Jun 9, 2003
Sold by
Bilaver Vesna
Bought by
Ferrato Jessica
Current Estimated Value
Purchase Details
Closed on
Mar 2, 2000
Sold by
Feser Thomas F
Bought by
Vilaver Vesna
Home Financials for this Owner
Home Financials are based on the most recent Mortgage that was taken out on this home.
Original Mortgage
$100,000
Interest Rate
8.27%
Purchase Details
Closed on
Jul 13, 1999
Sold by
Sterkel Virginia L
Bought by
Feser Thomas F
Purchase Details
Closed on
Mar 18, 1992
Sold by
Sterkel George J
Bought by
Sterkel Virginia L
Purchase Details
Closed on
Apr 28, 1987
Sold by
Montgomery Lee C and Montgomery Sheila M
Bought by
Sterkel George J
Purchase Details
Closed on
Dec 10, 1982
Sold by
Tsiros Fotini
Bought by
Montgomery Lee C and Montgomery Sheila M
Purchase Details
Closed on
Jan 1, 1975
Bought by
Tsiros Fotini
Create a Home Valuation Report for This Property
The Home Valuation Report is an in-depth analysis detailing your home's value as well as a comparison with similar homes in the area
Home Values in the Area
Average Home Value in this Area
Purchase History
| Date | Buyer | Sale Price | Title Company |
|---|---|---|---|
| Ferrato Jessica | $103,000 | Multiple | |
| Vilaver Vesna | $106,000 | Quality Title Agency Inc | |
| Feser Thomas F | $68,000 | -- | |
| Sterkel Virginia L | $28,200 | -- | |
| Sterkel George J | $49,000 | -- | |
| Montgomery Lee C | $47,000 | -- | |
| Tsiros Fotini | -- | -- |
Source: Public Records
Mortgage History
| Date | Status | Borrower | Loan Amount |
|---|---|---|---|
| Previous Owner | Vilaver Vesna | $100,000 |
Source: Public Records
Tax History Compared to Growth
Tax History
| Year | Tax Paid | Tax Assessment Tax Assessment Total Assessment is a certain percentage of the fair market value that is determined by local assessors to be the total taxable value of land and additions on the property. | Land | Improvement |
|---|---|---|---|---|
| 2024 | $4,820 | $75,040 | $19,285 | $55,755 |
| 2023 | $5,159 | $68,740 | $14,770 | $53,970 |
| 2022 | $5,192 | $68,740 | $14,770 | $53,970 |
| 2021 | $5,139 | $68,740 | $14,770 | $53,970 |
| 2020 | $4,607 | $53,270 | $11,450 | $41,830 |
| 2019 | $4,467 | $152,200 | $32,700 | $119,500 |
| 2018 | $4,034 | $52,680 | $11,450 | $41,230 |
| 2017 | $3,683 | $39,970 | $8,820 | $31,150 |
| 2016 | $3,658 | $39,970 | $8,820 | $31,150 |
| 2015 | $3,660 | $39,970 | $8,820 | $31,150 |
| 2014 | $3,660 | $38,430 | $8,470 | $29,960 |
Source: Public Records
Map
Nearby Homes
- 1542 Westwood Ave
- 1547 Orchard Grove Ave
- 1617 Westwood Ave
- 1507 Orchard Grove Ave
- 15555 Hilliard Rd Unit 401A
- 1578 Mars Ave
- 1450 Orchard Grove Ave
- 1563 Wagar Ave
- 1615 Wagar Ave
- 1431 Northland Ave
- 1437 Woodward Ave
- 1594 Victoria Ave
- 1500 Lauderdale Ave
- 1480 Warren Rd Unit 313
- 1480 Warren Rd
- 1420 Cordova Ave
- 17322 Archdale Ave
- 2209 Woodward Ave
- 1272 Virginia Ave
- 2165 Arthur Ave
- 1539 Rosewood Ave
- 1547 Rosewood Ave
- 1537 Rosewood Ave
- 1535 Rosewood Ave
- 1551 Rosewood Ave
- 1540 Westwood Ave
- 1531 Rosewood Ave
- 1555 Rosewood Ave
- 1536 Westwood Ave
- 1552 Westwood Ave
- 1532 Westwood Ave
- 1527 Rosewood Ave
- 1559 Rosewood Ave
- 1542 Rosewood Ave
- 1536 Rosewood Ave
- 1544 Rosewood Ave
- 1556 Westwood Ave
- 1528 Westwood Ave
- 1534 Rosewood Ave