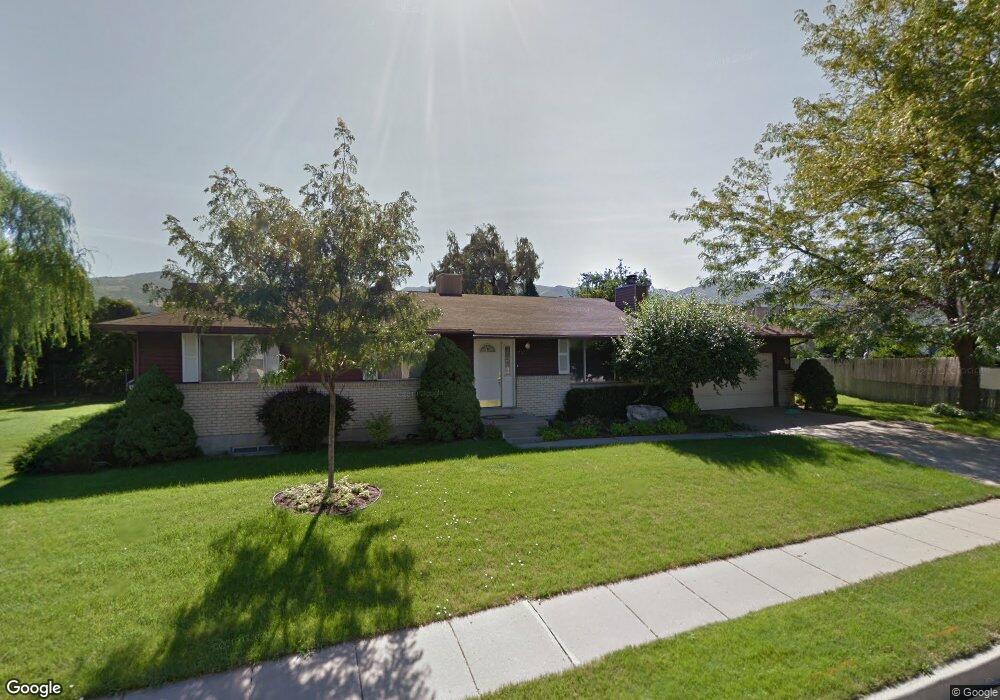
1543 Sorrento Dr Woods Cross, UT 84087
Estimated Value: $475,000 - $511,920
5
Beds
2
Baths
2,600
Sq Ft
$190/Sq Ft
Est. Value
About This Home
This home is located at 1543 Sorrento Dr, Woods Cross, UT 84087 and is currently estimated at $492,980, approximately $189 per square foot. 1543 Sorrento Dr is a home located in Davis County with nearby schools including Woods Cross Elementary School, South Davis Junior High School, and Woods Cross High School.
Ownership History
Date
Name
Owned For
Owner Type
Purchase Details
Closed on
Jul 31, 2025
Sold by
Peck Colby
Bought by
Utah Department Of Transportation
Current Estimated Value
Purchase Details
Closed on
Dec 28, 2020
Sold by
Peck Craig
Bought by
Peck Colby
Home Financials for this Owner
Home Financials are based on the most recent Mortgage that was taken out on this home.
Original Mortgage
$287,980
Interest Rate
2.8%
Mortgage Type
New Conventional
Purchase Details
Closed on
Oct 15, 2020
Sold by
Gr Mac Properties Llc
Bought by
Peck Craig
Purchase Details
Closed on
Aug 14, 2020
Sold by
Milgro Newcastle Inc
Bought by
Gr Mac Properties Llc
Purchase Details
Closed on
Jul 20, 1998
Sold by
Muir Raun S and Muir Susan M
Bought by
Milgro Newcastle Inc
Create a Home Valuation Report for This Property
The Home Valuation Report is an in-depth analysis detailing your home's value as well as a comparison with similar homes in the area
Home Values in the Area
Average Home Value in this Area
Purchase History
| Date | Buyer | Sale Price | Title Company |
|---|---|---|---|
| Utah Department Of Transportation | -- | None Listed On Document | |
| Peck Colby | -- | Cottonwood Title Ins Ag | |
| Peck Craig | -- | National Title Agen | |
| Gr Mac Properties Llc | -- | National Title Agen | |
| Milgro Newcastle Inc | -- | -- |
Source: Public Records
Mortgage History
| Date | Status | Borrower | Loan Amount |
|---|---|---|---|
| Previous Owner | Peck Colby | $287,980 |
Source: Public Records
Tax History Compared to Growth
Tax History
| Year | Tax Paid | Tax Assessment Tax Assessment Total Assessment is a certain percentage of the fair market value that is determined by local assessors to be the total taxable value of land and additions on the property. | Land | Improvement |
|---|---|---|---|---|
| 2025 | $2,886 | $247,500 | $117,494 | $130,006 |
| 2024 | $2,773 | $244,200 | $127,714 | $116,486 |
| 2023 | $2,651 | $435,000 | $171,344 | $263,656 |
| 2022 | $2,970 | $260,700 | $74,337 | $186,363 |
| 2021 | $2,548 | $371,000 | $110,041 | $260,959 |
| 2020 | $2,060 | $294,000 | $105,032 | $188,968 |
| 2019 | $2,040 | $287,000 | $96,912 | $190,088 |
| 2018 | $1,873 | $261,000 | $95,076 | $165,924 |
| 2016 | $1,560 | $118,635 | $43,578 | $75,057 |
| 2015 | $1,491 | $106,920 | $43,578 | $63,342 |
| 2014 | $1,396 | $105,868 | $43,578 | $62,290 |
| 2013 | -- | $97,606 | $26,596 | $71,010 |
Source: Public Records
Map
Nearby Homes