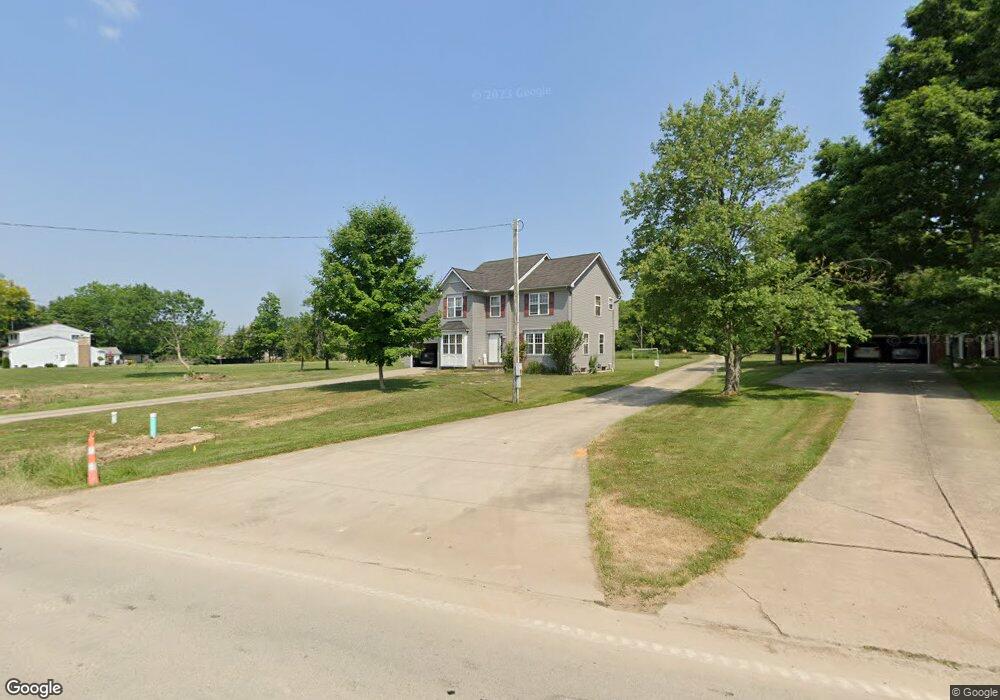
15432 Albion Rd Strongsville, OH 44136
Estimated Value: $308,000 - $352,000
3
Beds
3
Baths
1,808
Sq Ft
$185/Sq Ft
Est. Value
About This Home
This home is located at 15432 Albion Rd, Strongsville, OH 44136 and is currently estimated at $333,919, approximately $184 per square foot. 15432 Albion Rd is a home located in Cuyahoga County with nearby schools including Strongsville High School, Sts Joseph & John Interparochial School, and Royal Redeemer Lutheran School.
Ownership History
Date
Name
Owned For
Owner Type
Purchase Details
Closed on
Oct 11, 2024
Sold by
Fares Haitham M
Bought by
Fares Lorayne J
Current Estimated Value
Home Financials for this Owner
Home Financials are based on the most recent Mortgage that was taken out on this home.
Original Mortgage
$152,625
Outstanding Balance
$151,020
Interest Rate
6.35%
Mortgage Type
FHA
Estimated Equity
$182,899
Purchase Details
Closed on
Dec 17, 2003
Sold by
Wittenmyer Marilyn J and Wittenmyer Marilyn J Kral
Bought by
Fares Haitham M and Fares Lorayne J
Purchase Details
Closed on
Apr 17, 2003
Sold by
Wittenmyer Marilyn J and Wittenmyer Marilyn J Kral
Bought by
Fares Haitham M and Fares Lorayne J
Purchase Details
Closed on
Jul 30, 1999
Sold by
Wittenmyer Marilyn Jean and Panovec Irene Mildred
Bought by
Wittenmyer Marilyn
Purchase Details
Closed on
Sep 13, 1993
Sold by
Panovec Irene M
Bought by
Wittenmyer Marilyn
Purchase Details
Closed on
Jan 1, 1975
Bought by
Panovec Irene M
Create a Home Valuation Report for This Property
The Home Valuation Report is an in-depth analysis detailing your home's value as well as a comparison with similar homes in the area
Home Values in the Area
Average Home Value in this Area
Purchase History
| Date | Buyer | Sale Price | Title Company |
|---|---|---|---|
| Fares Lorayne J | -- | Infinity Title | |
| Fares Haitham M | -- | -- | |
| Fares Haitham M | -- | -- | |
| Wittenmyer Marilyn | -- | -- | |
| Wittenmyer Marilyn | -- | -- | |
| Panovec Irene M | -- | -- |
Source: Public Records
Mortgage History
| Date | Status | Borrower | Loan Amount |
|---|---|---|---|
| Open | Fares Lorayne J | $152,625 |
Source: Public Records
Tax History Compared to Growth
Tax History
| Year | Tax Paid | Tax Assessment Tax Assessment Total Assessment is a certain percentage of the fair market value that is determined by local assessors to be the total taxable value of land and additions on the property. | Land | Improvement |
|---|---|---|---|---|
| 2024 | $5,133 | $106,645 | $8,645 | $98,000 |
| 2023 | $5,514 | $86,040 | $12,150 | $73,890 |
| 2022 | $5,474 | $86,030 | $12,145 | $73,885 |
| 2021 | $5,306 | $86,030 | $12,150 | $73,890 |
| 2020 | $5,168 | $72,310 | $10,220 | $62,090 |
| 2019 | $5,001 | $206,600 | $29,200 | $177,400 |
| 2018 | $4,548 | $72,310 | $10,220 | $62,090 |
| 2017 | $4,163 | $61,110 | $8,050 | $53,060 |
| 2016 | $4,021 | $61,110 | $8,050 | $53,060 |
| 2015 | $8,481 | $61,110 | $8,050 | $53,060 |
| 2014 | $8,481 | $59,330 | $7,810 | $51,520 |
Source: Public Records
Map
Nearby Homes
- 0 Webster Rd
- 10010 Chevy Chase
- 9890 Webster Rd
- 9945 Twelve Oaks Cir
- 10369 Council Bluff
- 16519 Albion Rd
- 14069 Basswood Cir
- 14584 Baywood Ln
- 14557 Baywood Ln
- 9129 Tahoe Cir
- 14644 Baywood Ln
- 14298 Calderdale Ln
- 9531 Nicole Cir
- 12199 Webster Rd
- Buchanan Plan at The Enclave at Pine Lakes Crossing
- Belleville Plan at The Enclave at Pine Lakes Crossing
- 13402 Bridgecreek Cir
- 12101 The Bluffs
- 11650 River Moss Rd
- 17945 Cliffside Dr
- 15356 Albion Rd
- 15440 Albion Rd
- 15313 Albion Rd
- 15522 Albion Rd
- 15401 Albion Rd
- 15477 Albion Rd
- 15312 Albion Rd
- 10495 Ruggiero Dr
- 10471 Ruggiero Dr
- 15393 Albion Rd
- 15560 Albion Rd
- 15353 Albion Rd
- 10450 Ruggiero Dr
- 15523 Albion Rd
- 15602 Albion Rd
- 15228 Albion Rd
- 15563 Albion Rd
- 10472 Ruggiero Dr
- 10517 Ruggiero Dr
- 15644 Albion Rd