Estimated Value: $579,724 - $595,000
3
Beds
3
Baths
3,064
Sq Ft
$192/Sq Ft
Est. Value
About This Home
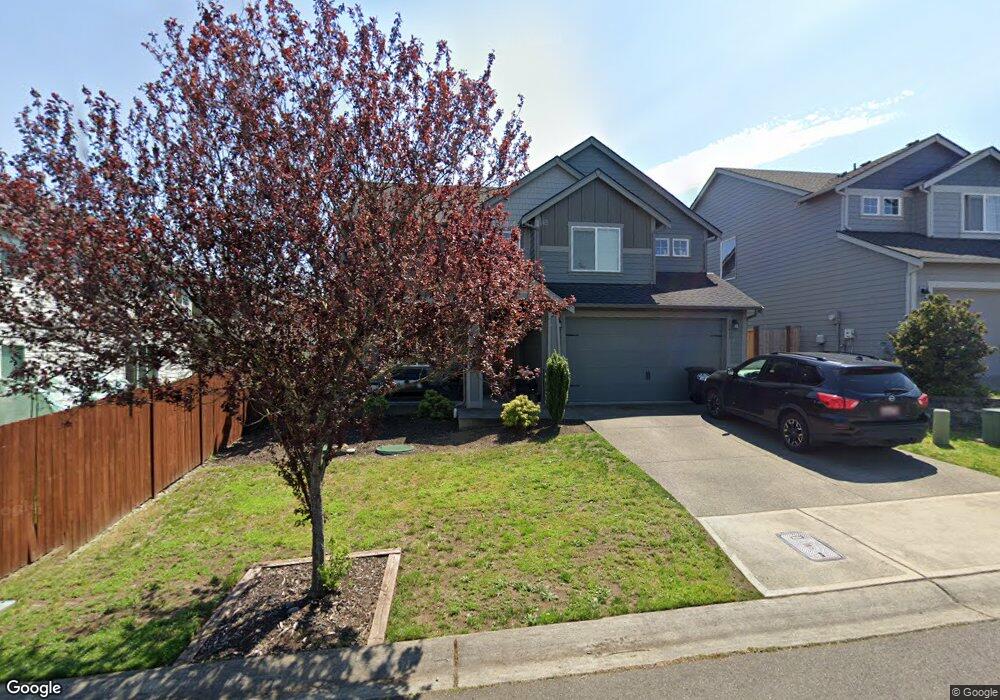
This home is located at 15433 Callie Ave SE Unit 128, Yelm, WA 98597 and is currently estimated at $588,681, approximately $192 per square foot. 15433 Callie Ave SE Unit 128 is a home located in Thurston County with nearby schools including Southworth Elementary School, Yelm Middle School, and Yelm High School.
Ownership History
Date
Name
Owned For
Owner Type
Purchase Details
Closed on
Aug 3, 2020
Sold by
Veasley Sydney M and Veasley Cavaughn I
Bought by
Webb Crystal and Webb Keith
Current Estimated Value
Home Financials for this Owner
Home Financials are based on the most recent Mortgage that was taken out on this home.
Original Mortgage
$320,000
Outstanding Balance
$283,755
Interest Rate
3.1%
Mortgage Type
New Conventional
Estimated Equity
$304,926
Purchase Details
Closed on
Jan 23, 2017
Sold by
Soundbuilt Homes Llc
Bought by
Veasley Sydney M and Veasley Cavaughn I
Home Financials for this Owner
Home Financials are based on the most recent Mortgage that was taken out on this home.
Original Mortgage
$324,785
Interest Rate
4.16%
Mortgage Type
VA
Purchase Details
Closed on
Sep 23, 2015
Sold by
Freestone Cherry Meadows Llc
Bought by
Soundbuilt Homes Llc
Create a Home Valuation Report for This Property
The Home Valuation Report is an in-depth analysis detailing your home's value as well as a comparison with similar homes in the area
Home Values in the Area
Average Home Value in this Area
Purchase History
| Date | Buyer | Sale Price | Title Company |
|---|---|---|---|
| Webb Crystal | $400,000 | Chicago Title | |
| Veasley Sydney M | $273,013 | First American Title | |
| Soundbuilt Homes Llc | $759,673 | First American Title |
Source: Public Records
Mortgage History
| Date | Status | Borrower | Loan Amount |
|---|---|---|---|
| Open | Webb Crystal | $320,000 | |
| Previous Owner | Veasley Sydney M | $324,785 |
Source: Public Records
Tax History Compared to Growth
Tax History
| Year | Tax Paid | Tax Assessment Tax Assessment Total Assessment is a certain percentage of the fair market value that is determined by local assessors to be the total taxable value of land and additions on the property. | Land | Improvement |
|---|---|---|---|---|
| 2024 | $4,989 | $528,800 | $125,000 | $403,800 |
| 2023 | $4,989 | $511,400 | $98,400 | $413,000 |
| 2022 | $4,878 | $476,400 | $50,500 | $425,900 |
| 2021 | $4,324 | $443,300 | $52,400 | $390,900 |
| 2020 | $4,245 | $341,600 | $35,700 | $305,900 |
| 2019 | $2,050 | $327,600 | $33,100 | $294,500 |
| 2018 | $4,438 | $327,500 | $24,300 | $303,200 |
| 2017 | $710 | $54,350 | $20,450 | $33,900 |
| 2016 | $406 | $30,200 | $30,200 | $0 |
| 2014 | -- | $29,050 | $29,050 | $0 |
Source: Public Records
Map
Nearby Homes
- 15410 91st Ave SE
- 15331 92nd Ave SE
- 15730 91st Way SE
- 9230 Conine St SE
- 9040 Mountain View Rd SE
- 14951 91st Ave SE
- 14711 Washington 510
- 15826 Woodland Ct SE Unit 14
- 15832 Woodland Ct SE Unit 15
- 9413 Chief Leschi St SE Unit 8
- 9419 Chief Leschi St SE Unit 7
- 14721 88th Ave SE Unit 19
- 9431 St SE Unit 5
- 9437 Chief Leschi St SE Unit 4
- 14905 Prairie Vista Loop SE
- 1502 Yelm Ave W Unit 7
- 14856 91st Ave SE
- The Laurel Plan at Crystal Springs
- The Avalon Plan at Crystal Springs
- The Finch Plan at Crystal Springs
- 15433 Callie Ave SE
- 15427 Callie Ave SE Unit 129
- 15493 Chad Dr SE
- 15436 92nd Ave SE
- 15421 Callie Ave SE
- 15430 92nd Ave SE
- 154411 92nd Ave SE
- 15499 Chad Dr SE
- 15424 92nd Ave SE
- 15426 Callie Ave SE
- 15426 Calle Ave SE
- 15415 Callie Ave SE Unit CH131
- 15415 Callie Ave SE
- 15420 Calle Ave SE
- 15432 Callie Ave SE
- 15414 Callie Ave SE
- 15414 Calle Ave SE