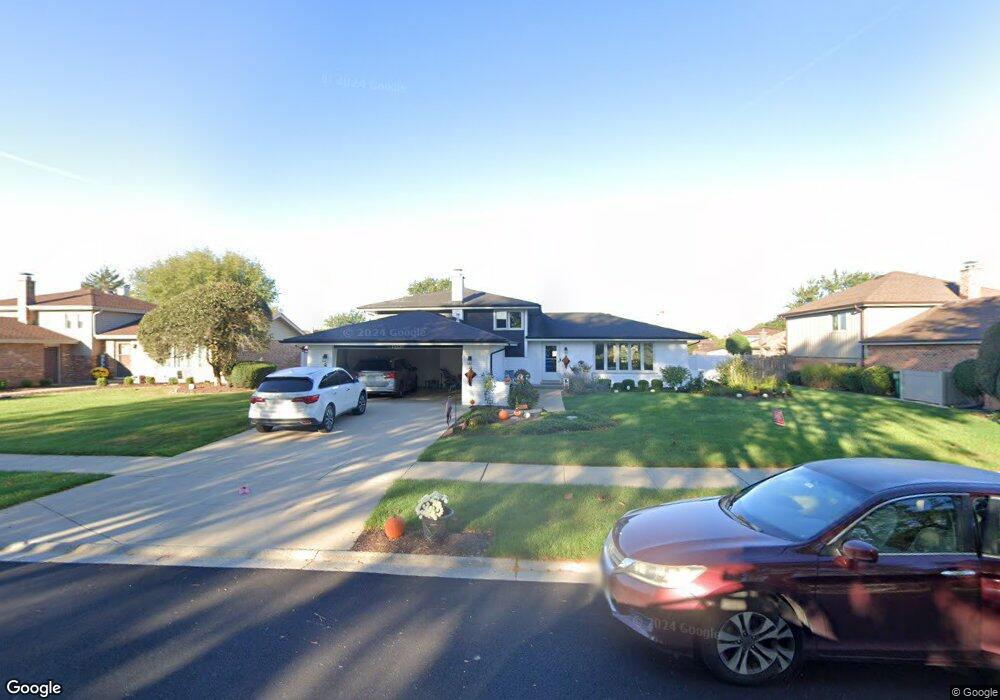
15438 Raintree Dr Unit 2 Orland Park, IL 60462
Silver Lake South NeighborhoodEstimated Value: $410,000 - $433,000
3
Beds
2
Baths
2,000
Sq Ft
$209/Sq Ft
Est. Value
About This Home
This home is located at 15438 Raintree Dr Unit 2, Orland Park, IL 60462 and is currently estimated at $418,888, approximately $209 per square foot. 15438 Raintree Dr Unit 2 is a home located in Cook County with nearby schools including Prairie Elementary School, Liberty Elementary School, and Jerling Junior High School.
Ownership History
Date
Name
Owned For
Owner Type
Purchase Details
Closed on
Jul 23, 2024
Sold by
Marquette Bank
Bought by
Mccormick Clare E
Current Estimated Value
Purchase Details
Closed on
May 7, 2019
Sold by
Mccormick Sheila A
Bought by
Trust Number 30346 and Marquette Bank
Purchase Details
Closed on
Nov 22, 2010
Sold by
Mensik Cheryl and Mensik Robert Martin
Bought by
Mccormick Sheila A
Home Financials for this Owner
Home Financials are based on the most recent Mortgage that was taken out on this home.
Original Mortgage
$228,265
Interest Rate
4.4%
Mortgage Type
FHA
Purchase Details
Closed on
Mar 30, 2009
Sold by
Mensik Cheryl C
Bought by
Mensik Cheryl and Mensik Robert Martin
Purchase Details
Closed on
Nov 10, 2008
Sold by
Spoto Jeanette and Spoto Louis C
Bought by
Spoto Louis C and Mensik Cheryl C
Purchase Details
Closed on
Nov 24, 2000
Sold by
Spoto Louis and Spoto Jeanette
Bought by
Spoto Louis C and Spoto Jeanette
Create a Home Valuation Report for This Property
The Home Valuation Report is an in-depth analysis detailing your home's value as well as a comparison with similar homes in the area
Home Values in the Area
Average Home Value in this Area
Purchase History
| Date | Buyer | Sale Price | Title Company |
|---|---|---|---|
| Mccormick Clare E | -- | None Listed On Document | |
| Trust Number 30346 | -- | None Available | |
| Mccormick Sheila A | $238,000 | Chicago Title Insurance Co | |
| Mensik Cheryl | -- | None Available | |
| Spoto Louis C | -- | None Available | |
| Spoto Louis C | -- | -- |
Source: Public Records
Mortgage History
| Date | Status | Borrower | Loan Amount |
|---|---|---|---|
| Previous Owner | Mccormick Sheila A | $228,265 |
Source: Public Records
Tax History Compared to Growth
Tax History
| Year | Tax Paid | Tax Assessment Tax Assessment Total Assessment is a certain percentage of the fair market value that is determined by local assessors to be the total taxable value of land and additions on the property. | Land | Improvement |
|---|---|---|---|---|
| 2024 | $7,015 | $34,000 | $6,450 | $27,550 |
| 2023 | $5,769 | $34,000 | $6,450 | $27,550 |
| 2022 | $5,769 | $25,416 | $5,676 | $19,740 |
| 2021 | $5,619 | $25,416 | $5,676 | $19,740 |
| 2020 | $5,523 | $25,416 | $5,676 | $19,740 |
| 2019 | $3,886 | $25,149 | $5,160 | $19,989 |
| 2018 | $4,880 | $25,149 | $5,160 | $19,989 |
| 2017 | $3,636 | $25,149 | $5,160 | $19,989 |
| 2016 | $5,005 | $22,217 | $4,644 | $17,573 |
| 2015 | $4,897 | $22,217 | $4,644 | $17,573 |
| 2014 | $6,049 | $22,217 | $4,644 | $17,573 |
| 2013 | $4,649 | $22,646 | $4,644 | $18,002 |
Source: Public Records
Map
Nearby Homes
- 15713 Orlan Brook Dr Unit 98
- 15726 Orlan Brook Dr Unit 193
- 15137 Quail Hollow Dr Unit 203
- 15817 Orlan Brook Dr Unit 35
- 15826 Orlan Brook Dr Unit 3S
- 15636 Chapel Hill Rd
- 9203 Wheeler Dr
- 9180 136th St
- 15324 Regent Dr
- 15336 Regent Dr
- 9291 Erin Ln Unit D7
- 9061 Somerset Ct Unit 16
- 16001 S 88th Ave Unit 202
- 9314 Wherry Ln Unit D
- 8215 Saint Andrews Dr
- 15624 Sunset Ridge Dr
- 15426 S 82nd Ave
- 9350 Waterford Ln Unit C16
- 9337 Waterford Ln Unit D3
- 15963 91st Ave
- 15450 Raintree Dr
- 15426 Raintree Dr
- 15433 Pembridge Rd
- 15414 Raintree Dr
- 8705 Raintree Ln
- 15425 Pembridge Rd
- 15466 Raintree Dr
- 8802 Wheeler Dr
- 8704 Wheeler Dr
- 8817 Abbey Ln
- 15417 Pembridge Rd
- 8808 Wheeler Dr
- 8693 Raintree Ln
- 15400 Raintree Dr
- 15413 Raintree Dr
- 8692 Wheeler Dr
- 15409 Pembridge Rd
- 8816 Wheeler Dr
- 15401 Raintree Dr
- 8681 Raintree Ln